Unveiling the Guppy Multiple Moving Average (GMMA)
The Guppy Multiple Moving Average (GMMA) stands as a robust and noteworthy technical index. Specifically designed to predict potential price shifts of an asset, this remarkable index is the brainchild of Daryl Guppy, an eminent Australian financial analyst and accomplished author. Guppy first introduced this insightful concept in his acclaimed book, "Trading Tactics".
Central to the GMMA is the Exponential Moving Average (EMA), an innovative tool employed to illuminate the subtle yet critical discrepancy between an asset's prevailing price and its inherent value. A convergence of these pivotal elements often signals an impending substantial shift in the market trend. Guppy's unique perspective insists that the GMMA is far from a mere lagging indicator; instead, it serves as an early warning system for potential changes in an asset's price and value dynamics.
Delving Deeper: Key Aspects of GMMA
At its core, the GMMA functions as a strategic tool to pinpoint trend changes, unveil hidden breakouts, and identify lucrative trading possibilities. This is accomplished by skillfully integrating two sets of moving averages (MAs) with distinct durations. The GMMA configuration comprises a short-term group coupled with a long-term group of MAs, each featuring six MAs. This collection of 12 MAs is meticulously plotted over an asset's price graph to form the GMMA.
The short-term MAs are typically established for 3, 5, 8, 10, 12, and 15 periods. On the other hand, the long-term MAs cater to 30, 35, 40, 45, 50, and 60 periods. An instance where the short-term averages eclipse the long-term ones can serve as a potent signal of a potential upward price trend. In contrast, a drop of the short-term averages below the long-term group could be a precursor to a downward price trend.
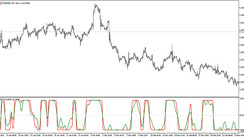
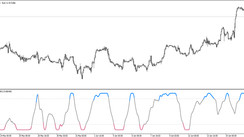
Pure GMMA analysis: Here the candlesticks (price bars) are removed and we can analyze the trend just by looking at the GMMA
Cracking the Code: GMMA Formula and Calculation
The Guppy indicator operates on the principle of exponential moving averages (EMA), integrating a short-term and a long-term group of MAs, each comprising six MAs, amounting to a total of 12 MAs. The number of periods, symbolized by N, can be modified according to the user's preferences for the computation of each MA value.
The process of calculating the GMMA involves several steps:
- Begin with the computation of the Simple Moving Average (SMA) for N.
- Proceed to calculate the multiplier utilizing the same N value.
- Next, incorporate the latest closing price, the multiplier, and SMA to calculate the EMA, substituting the SMA in the EMA previous day slot.
- Continue this process for the succeeding N value until all 12 MAs' EMA values have been determined.
Reading the GMMA: A Deeper Look into Its Interpretations
The Guppy Multiple Moving Average (GMMA) offers a host of critical insights into market trends, trend strength, and potential trend reversals. One of the defining characteristics of the GMMA is the discernible degree of separation between the short-term and long-term MAs, which serves as a key indicator of trend strength. Here's how to interpret it:
-
A wide separation between the two sets of MAs is indicative of a strong prevailing trend. In this scenario, the prices are moving steadily either upwards or downwards, showcasing a significant momentum in the market movement. Traders can utilize this as a green light to continue with their trend-based trading strategies.
-
Narrow separation or intersecting lines suggest a weakening trend or a period of market consolidation. During these times, the asset's price often fluctuates within a confined range, hinting at uncertainty and reduced market momentum. It's important for traders to exercise caution in such situations, as a trend reversal may be imminent.
-
A rapid convergence or divergence of the two sets of MAs often suggests a breakout. A breakout refers to when the price of an asset moves above a resistance level or falls below a support level on heavy volume. Identifying these points can assist traders in making informed decisions about entering or exiting trades.
The crossover of the short-term and long-term MAs provides valuable insights into potential trend reversals:
-
When the short-term MAs cross above the long-term MAs, a bullish reversal is signaled. This suggests that the upward momentum in the market is strong, potentially leading to an increase in asset prices. Traders can use this as an opportunity to buy or go long on the asset.
-
Conversely, when the short-term MAs dip below the long-term MAs, a bearish reversal is inferred. This implies that the market is losing its bullish momentum and a downtrend in prices could be on the horizon. Traders may choose to sell their holdings or short the asset in anticipation of the price decline.
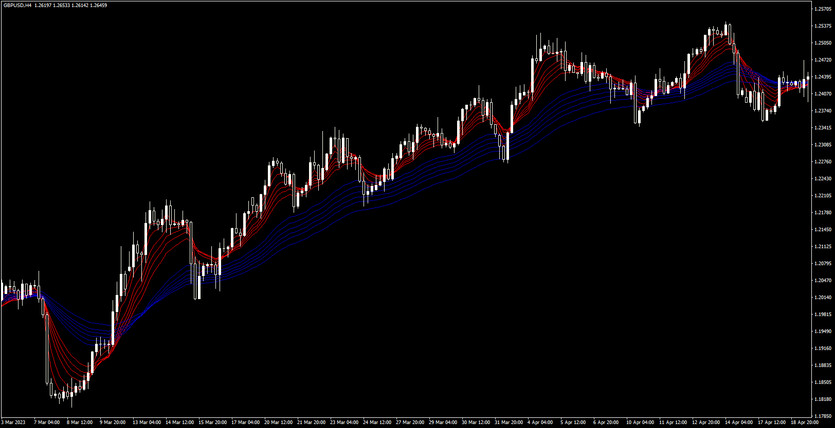
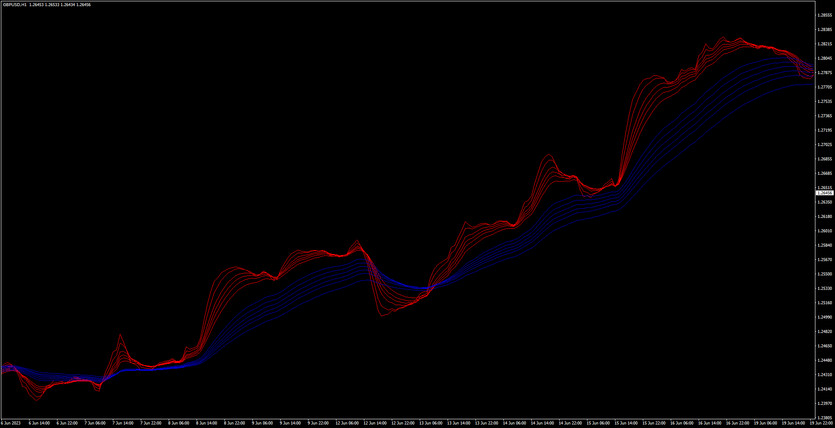
The GMMA plotted alongside price bars
When both sets of MAs move horizontally or exhibit mostly sideways movement, this usually means the asset is devoid of a clear price trend, making it less favorable for trend-based trading. However, these periods can be advantageous for range trading. In such scenarios:
-
If the MAs are moving sideways and are heavily intertwined, this often suggests that the asset lacks a clear price trend, which makes it less suitable for trend trades.
-
These periods of horizontal movement or consolidation, however, can offer excellent opportunities for range trading. Traders might look to buy at the lower range and sell at the upper range, capitalizing on the price fluctuations within this range.
Remember, while the GMMA can indicate trend shifts or gauge current trend strength, it performs optimally when used alongside other technical indicators. The overall interpretation of the GMMA should be a key part of a more comprehensive trading strategy that takes into account multiple indicators and aspects of market analysis.
Delineating the GMMA and the Exponential Moving Average (EMA): A Comparative Analysis
In essence, the Guppy Multiple Moving Average (GMMA) and the Exponential Moving Average (EMA) share fundamental similarities, given the GMMA's construction incorporates twelve EMAs. However, these technical indicators perform distinctive roles and offer unique advantages:
-
The Ensemble of EMAs: The GMMA isn't just a single EMA; it's a collection of 12 EMAs grouped into short-term and long-term sets. The designer of the GMMA intended this structure to offer a multi-faceted perspective on the market, granting traders the ability to isolate trades, spot potential opportunities, and receive alerts about potential price reversals.
-
Improved Visualization of Trend Strength: The GMMA's multitude of lines provide a visual representation of the short-term and long-term traders' sentiments. This allows for a more nuanced understanding of the strength or weakness of a trend compared to using just one or two EMAs. By observing the behavior and interaction of these multiple lines, traders can assess the trend's robustness or the likelihood of a potential trend reversal.
-
Greater Versatility: The GMMA, by virtue of its design, provides a more versatile analysis tool than a single EMA. The GMMA captures short-term sentiment, long-term sentiment, and the interactions between the two, offering a more holistic view of market behavior.
Remember, while the GMMA provides more information than a single EMA, both these technical indicators serve as components of a comprehensive trading strategy. The appropriate usage depends on the individual trader's objectives, trading style, and risk tolerance. As always, it's essential to validate signals from these indicators with additional technical analysis tools to increase the odds of successful trading.
Recognizing the Limitations of GMMA
The primary drawback of the GMMA, and by extension the EMAs it comprises, is its nature as a lagging indicator, given it represents historical average prices and doesn't offer future predictions. Often, a late entry or exit might occur due to the delay in waiting for the averages to intersect, leading to considerable price movements. All MAs are susceptible to whipsaws, which involve a crossover that triggers a trade, but the price fails to perform as anticipated, leading to another crossover and potential loss.
Therefore, it's advisable to use GMMA alongside other technical indicators, like the relative strength index (RSI), to ascertain if a trend is nearing a reversal, or various chart patterns to identify other entry or exit points after a GMMA crossover.
Please note, the information provided doesn't serve as investment, financial, or tax advice and may not be suitable for all investors. Investments carry risks, including potential loss of the principal amount.