
Earning profits from the stock market can be a tricky endeavor, particularly when attempting to predict its fluctuating behavior. If you're interested in short-term trading of stocks and options, it's considerably more intricate compared to a long-term, buy-and-hold investment strategy. To navigate these waters more successfully, it's crucial to equip yourself with knowledge and tools to gauge a stock's potential performance and direction. One such invaluable instrument is the Relative Strength Index (RSI), which can guide you in making decisions about purchasing, selling or holding onto stocks.
Understanding the Relative Strength Index (RSI)
The RSI stands as a widely utilized momentum oscillator, a sophisticated term denoting a tool that gauges the magnitude of price variations for a security over a defined period. It is the brainchild of J. Welles Wilder, a mechanical engineer turned technical analyst, who designed the RSI to monitor both the pace and magnitude of price shifts of a specific stock.
The RSI ranges between zero and 100. According to Wilder's conventional model, an RSI above 70 implies an overbought stock, signaling a discrepancy between the trading value and the inherent value of the asset. In contrast, an RSI below 30 signifies that a stock is oversold, or its price is undervalued. The market's condition also plays a significant role. During a bull market, RSIs generally hover between 40 and 90, while in a bear market, they fall between 10 and 60.
How Is the Relative Strength Index Calculated?
The RSI calculation involves averaging the gains and losses of the closing prices over the most recent 14-day period. The resultant figures then feed into a specific formula:
RSI = 100 – [100 / (1 + (Average Gain / Average Loss))]
The Interplay of RSI and Price Divergence
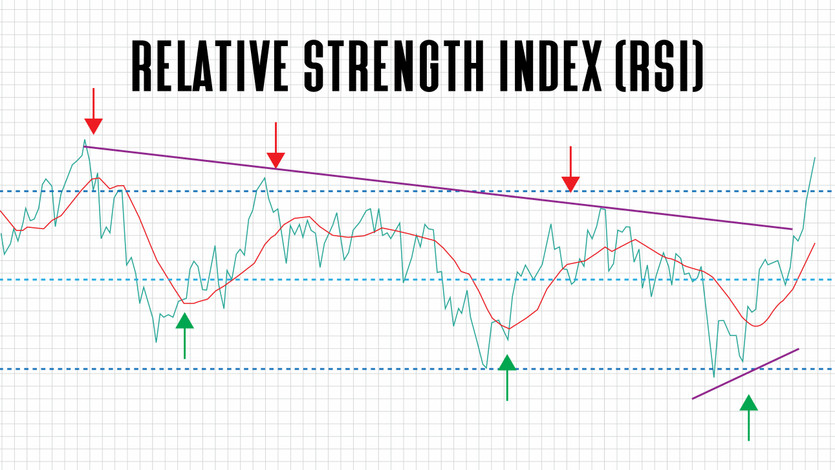
Price divergence, a term technical analysts use when stock prices veer in the opposite direction of an indicator like RSI, is an effective method for pinpointing short-term trading opportunities. A bearish divergence arises when the price hits higher highs but the RSI makes lower highs, signaling potential upcoming price decline. A bullish divergence, on the other hand, appears when the RSI makes a higher low while the stock price drops to lower lows, indicating potential price momentum upwards.
Applying the RSI in Trading
Investors and stock traders can leverage the RSI to identify stocks that are poised for price movement. Wilder's approach finds the RSI most reliable when the numbers reach extremes on the scale. For example, a stock's RSI at one could indicate an undervalued stock, making it an attractive purchase. Conversely, a stock with an RSI of 95 is likely overvalued and might be due for a price drop, suggesting it might be a good time to sell.
Limitations of the RSI
However, the RSI isn't without its drawbacks. It doesn't incorporate all influencing factors and only considers the price changes of a security over a short period. Company news or global events that can significantly impact prices aren't included. As a lagging indicator, the RSI reflects past pricing changes and speed, but past performance doesn't necessarily predict future performance. Lastly, the RSI’s 14-day calculation window might be too short to effectively assess a stock's performance.
The RSI and Index Funds
If you're a long-term investor focusing on index funds, the RSI might not be as applicable. Index funds aim to mimic the performance of a specific stock market index and generally have less dramatic price fluctuations. In such cases, a buy-and-hold investment strategy might be more suitable.
Using the RSI to Guide Investment Decisions
The RSI is most beneficial for active investors or traders managing their portfolios and making independent decisions about stocks. It can assist in identifying opportunities but should be one among many considerations. If you prefer passive investment strategies, the RSI might be less relevant. A financial advisor could be a valuable resource if you need guidance with your investments.
Trading Strategy with RSI
A practical intraday forex trading strategy incorporates the RSI and at least one additional confirming indicator. Monitor the RSI for signs of overbuying or overselling. Verify these signs with other momentum or trend indicators for anticipated retracement signs. Initiate a trade aimed at profiting from retracement once specific conditions are met.
In conclusion, the RSI is a valuable tool for those who play an active role in managing their portfolios. It offers insights into the momentum of a particular stock, helping traders make informed decisions about when to buy, sell, or hold a stock. Despite its limitations, when used in conjunction with other strategies and indicators, the RSI can be an effective tool in a trader's arsenal.
Concluding Thoughts
The Relative Strength Index (RSI) is indeed a powerful instrument in the hands of an investor or trader. Despite its limitations, it can offer valuable insight into stock momentum, providing crucial information to help make informed decisions about whether to buy, sell, or hold a stock. While the RSI may not account for all factors impacting a stock's price, it serves as an excellent starting point for those interested in short-term trading. Additionally, for long-term investors, particularly those leaning towards index funds, the RSI may have less relevance, but its principles can still offer general market insight. Remember, successful investing often involves a combination of various tools, strategies, and insights. Whether you're an active trader or prefer a more passive investment strategy, understanding how to use the RSI can enhance your trading toolkit, paving the way for more informed and strategic investment decisions.