Analysing historical DJIA data provides valuable insights for traders looking to make informed investment decisions. By studying past trends and patterns, traders can better understand market behaviour, identify potential opportunities, and manage risks more effectively.
This article explores the significance of historical DJIA data and its implications for traders in today's dynamic financial landscape.
Understanding the DJIA and its importance
The DJIA (Dow Jones Industrial Average) is one of the world's most widely recognised and followed stock market indices. It represents the performance of 30 large, publicly traded companies listed on the New York Stock Exchange (NYSE) and the NASDAQ. The DJIA is often seen as a barometer of the overall health and direction of the U.S. stock market and, by extension, the broader economy.
The DJIA's importance stems from several factors. First, it provides a snapshot of the stock market's performance by tracking the price movements of influential companies across various sectors such as technology, finance, healthcare, and manufacturing. As such, changes in the DJIA are often interpreted as indicators of market sentiment and investor confidence.
Second, the DJIA is a benchmark against which investment portfolios and mutual funds can be compared. Many financial professionals and individual investors use the DJIA as a reference point to assess their investments' relative performance and make informed decisions about asset allocation.
Furthermore, market participants, economists, and researchers extensively study and analyse the DJIA's historical data. By examining past trends and patterns in the DJIA, analysts can gain insights into market cycles, identify potential opportunities or risks, and make projections about future market behaviour.
The DJIA's importance extends beyond the financial sector as well. It frequently makes headlines in mainstream media, influencing public perception and shaping broader economic narratives. Changes in the DJIA can impact consumer confidence, corporate decision-making, and even government policies.
The DJIA is a prominent indicator of the U.S. stock market's performance and holds significant importance for investors, financial professionals, and the broader economy. Its ability to reflect market sentiment, serve as a benchmark, and provide historical insights make it a valuable tool for understanding and navigating the complexities of the financial world.
What can we learn from analysing DJIA data?
Analysing DJI (Dow Jones Industrial Average) data can provide valuable insights and knowledge for traders and investors. Here are some key learnings that can be derived from analysing DJI data:
- Market Trends and Patterns: DJI data allows traders to find and understand market trends and patterns. By examining historical price movements, traders can recognise recurring patterns such as uptrends, downtrends, consolidations, or reversals. This knowledge can help make informed decisions about market entry and exit points.
- Market Sentiment and Investor Behaviour: DJI data reflects investors' collective sentiment and behaviour. By analysing DJI data, traders can gauge market sentiment, whether it's bullish (positive), bearish (negative), or ranging (sideways). This understanding of market sentiment can help traders align their strategies accordingly.
- Support and Resistance Levels: DJI data analysis can reveal crucial support and resistance levels. Support levels are price levels at which the DJI tends to find buying interest and reverses its downward movement. On the other hand, resistance levels are price levels at which the DJI faces selling pressure and struggles to break above. These levels can serve as reference points for setting profit targets or stop-loss orders.
- Volatility and Risk Management: DJI data provides insights into market volatility. Volatility refers to the magnitude and frequency of price fluctuations. Traders can use historical DJI data to assess volatility levels and adjust their risk management strategies accordingly. Volatile periods may require wider stop-loss orders, while low-volatility periods may call for tighter risk controls.
- Correlations and Diversification: Analysing DJI data allows traders to understand correlations between the DJI and other assets, such as individual stocks, sectors, or even global markets. This knowledge helps traders diversify their portfolios by finding assets with low or negative correlations with the DJI, thereby reducing overall risk.
- Long-Term Market Outlook: DJI data analysis can provide insights into the long-term market outlook. By studying historical DJI trends, traders can gain an understanding of market cycles, economic cycles, and secular trends. This knowledge can be used to develop long-term investment strategies or find potential turning points in the market.
- Decision-Making and Strategy Development: Analysing DJI data enhances traders' decision-making capabilities and helps develop effective trading strategies. Traders can make more informed and confident trading decisions by combining historical data analysis with other technical indicators, fundamental analysis, or market news.
Analysing DJI data can give traders and investors valuable insights into market trends, sentiment, support and resistance levels, volatility, correlations, and long-term market outlook. These learnings help make informed trading decisions, manage risks effectively, and effective investment strategies.
Identifying Trends from DJI Data
Identifying trends from DJI (Dow Jones Industrial Average) data is crucial in analysing the market and making informed trading decisions. Here are eight steps to identify trends from DJI data:
- Plotting Price Data: Start by plotting the historical price data of the DJI on a chart. This can be done using various charting platforms or software. The x-axis represents time, while the y-axis represents the DJI's price levels.
- Trendlines: Draw trendlines on the chart to connect the successive highs or lows. An uptrend is formed by connecting higher lows, while a downtrend is formed by connecting lower highs. Trendlines provide a visual representation of the overall direction of the market.
- Moving Averages: Apply moving averages to smooth out the price data and find trends. Commonly used moving averages are the 50-day moving average (short-term trend) and the 200-day moving average (long-term trend). When the price is above the moving average, it shows an uptrend; when it is below, it indicates a downtrend.
- Price Swings: Identify price swings within the trend. A swing high occurs when the price reaches a temporary peak before declining, while a swing low occurs when the price reaches a temporary trough before rising. These swings help define the structure of the trend and can be used to spot potential reversal points.
- Chart Patterns: Look for chart patterns that indicate the continuation or reversal of a trend. Common patterns include ascending triangles, descending triangles, head and shoulders, and double tops or bottoms. These patterns can provide insights into the strength and potential duration of the trend.
- Volume Analysis: Consider volume alongside price movements to validate trends. Higher volume during an uptrend suggests buying interest and supports the trend, while higher volume during a downtrend shows selling pressure. Lower volume during a consolidation phase may indicate a potential trend reversal.
- Trend Confirmation: Confirm the identified trend using multiple technical indicators, such as the Relative Strength Index (RSI), Moving Average Convergence Divergence (MACD), or the Average Directional Index (ADX). These indicators can provide added signals and strengthen the conviction in the identified trend.
- Monitor and Adjust: Continuously monitor the DJI data and reassess the identified trends as the market evolves. Trends can change or weaken over time, so adapting and adjusting trading strategies is essential.
Remember, identifying trends is not foolproof, and false signals can occur. It's crucial to use a combination of analysis techniques, indicators, and risk management strategies to validate and confirm trends before making trading decisions based on DJI data.
Strategies to Trade using Historic DJI Trends
Trading with historic DJI trends involves leveraging past price patterns and market behaviour to make trading decisions. Here are some strategies to consider when trading with historic DJI trends:
● Trend Following: This strategy involves finding the prevailing trend in DJI data and trading in the same direction. If the trend is upward (bullish), traders look for opportunities to buy or enter long positions. Conversely, if the trend is downward (bearish), traders seek opportunities to sell or enter short positions. Trend-following indicators such as moving averages or trendlines can help show and confirm the direction of the trend.
● Breakout Trading: Breakout trading involves entering positions when the DJI breaks above a resistance level during an uptrend or below a support level during a downtrend. Traders monitor key price levels and wait for a significant breakout with substantial volume before initiating trades. This strategy aims to capture powerful price movements that may occur following a breakout.
● Pullback Trading: Also known as retracement trading, this strategy involves entering positions during temporary price pullbacks within an established trend. Traders wait for the DJI to retrace or correct against the prevailing trend and look for potential reversal or continuation signals, such as candlestick patterns, chart patterns, or indicators. The goal is to enter at a favourable price during a retracement before the trend resumes.
● Support and Resistance Trading: Traders find key support and resistance levels based on historical DJI data and use them to make trading decisions. When the DJI approaches a support level, traders may look for bullish signals or reversal patterns to initiate long positions. Similarly, traders may consider bearish signals or reversal patterns to enter short positions when the DJI nears a resistance level.
● Risk Management: Effective risk management is crucial when trading with historic DJI trends, regardless of the strategy used. Traders can employ techniques such as setting stop-loss orders to limit potential losses if the market moves against their positions. Additionally, position sizing based on risk tolerance and proper portfolio diversification can help manage overall risk exposure.
● Confirmation with Indicators: Traders can enhance their trading decisions by using technical indicators that complement the analysis of historic DJI trends. Indicators such as the Relative Strength Index (RSI), Moving Average Convergence Divergence (MACD), or Stochastic Oscillator can provide added signals to confirm trends or identify potential overbought or oversold conditions.
● Regular Evaluation and Adaptation: Markets evolve, and trends can change. It's essential to regularly evaluate the effectiveness of trading strategies based on historic DJI trends and make necessary adjustments. Traders should stay updated with current market conditions, news, and economic factors that could influence the DJI's behaviour.
No strategy guarantees profits, and trading involves inherent risks. Traders should thoroughly back-test and confirm their strategies using historic DJI data, practice proper risk management, and consider an integrated approach incorporating fundamental analysis, market sentiment, and other factors before executing trades.
Technical Analysis for Historical DJI Trends [1]
Technical analysis is a widely used approach for analysing historical DJI trends. It involves studying past price data, chart patterns, and various technical indicators to predict future price movements. Here are some critical elements of technical analysis to consider when analysing historical DJI trends:
Price Charts: Price charts are the foundation of technical analysis. Traders use several types of charts, such as line charts, bar charts, or candlestick charts, to visualise the historical price movements of the DJI. These charts provide insights into the trend direction, support and resistance levels, and patterns that have formed over time.
Trend Analysis: Traders analyse historical DJI data to find the prevailing trends, whether uptrend, downtrend or a sideways (range-bound) market. Trend lines, moving averages, and trend-following indicators like the Average Directional Index (ADX) are commonly used to determine the strength and duration of the trend.
Chart Patterns: Chart patterns appear on price charts and provide insights into potential future price movements. Traders look for patterns such as head and shoulders, double tops or bottoms, triangles, and flags. These patterns can show trend reversals or continuation and help traders make trading decisions based on historical DJI data.
Support and Resistance Levels: Support and resistance levels are price levels where the DJI has historically encountered buying or selling pressure, respectively. By identifying these levels using historical DJI data, traders can anticipate potential price reactions. Support and resistance levels can act as decision points for entering or exiting trades or setting stop-loss and take-profit levels.
Technical Indicators: Technical indicators are mathematical calculations applied to historical DJI data to generate trading signals or provide added insights. Typical indicators used in DJI analysis include moving averages, relative strength index (RSI), stochastic oscillator, MACD (moving average convergence divergence), and Bollinger Bands. These indicators help find overbought or oversold conditions, confirm trends, or generate entry and exit signals.
Volume Analysis: Volume is a crucial component of technical analysis. Traders can analyse volume patterns alongside price movements by examining historical DJI data. Increased volume during price advances or declines suggests strong market participation and confirms the validity of the trend. The divergence between volume and price can provide valuable insights into potential trend reversals.
Back-testing and Validation: Traders often back-test their technical analysis strategies using historical DJI data to assess the effectiveness of their approach. Back-testing involves applying the chosen indicators, chart patterns, and trading rules to historical data and evaluating the outcomes. This helps traders understand the strengths and weaknesses of their strategies and make any necessary adjustments.
It's important to note that technical analysis is not foolproof and should be used with other analysis and risk management strategies. Traders should consider incorporating fundamental analysis, market news, and economic factors to gain a holistic view of the DJI's trends and make well-informed trading decisions.
Using Analytics Tools to Analyse DJI Data
Using analytics tools can significantly enhance the analysis of DJI (Dow Jones Industrial Average) data, providing traders with valuable insights and opportunities for informed decision-making. Here are some commonly used analytics tools to analyse DJI data:
● Back-testing Platforms: Back-testing platforms allow traders to test their trading strategies using historical DJI data. Platforms like MetaTrader, TradeStation, or NinjaTrader provide historical data and a simulated trading environment to evaluate strategies. Traders can assess their strategies' performance, profitability, and risk metrics before deploying them in live markets, helping refine their approaches based on DJI historical data.
● Sentiment Analysis Tools: Sentiment analysis tools monitor news articles, social media feeds, and other sources to gauge the market sentiment surrounding DJI components or broader market sentiment. Natural language processing (NLP) techniques and sentiment analysis algorithms help find positive or negative sentiment, allowing traders to incorporate sentiment data alongside DJI analysis for a comprehensive view of market dynamics.
● Risk Management Tools: Risk management tools assist traders in assessing and managing risk associated with DJI trading. These tools calculate risk metrics such as value at risk (VaR), maximum drawdown, or position sizing based on historical DJI data. They help traders set appropriate stop-loss levels, risk-reward ratios, and decide position sizes to control potential losses effectively.
● Real-Time Market Data Providers: Real-time market data providers like Bloomberg Terminal, Thomson Reuters Eikon, or Quandl offer comprehensive DJI data feeds, including historical and intraday price data, news, economic indicators, and other relevant information. These platforms enable traders to stay updated with DJI developments, access real-time analytics and make prompt decisions based on accurate and current data.
When utilising analytics tools, it's crucial to understand their features, limitations and ensure data accuracy. Traders should also consider combining different tools and approaches to understand DJI data and make well-informed trading decisions comprehensively.
The Impact of News on DJI Trends
News plays a significant role in influencing DJI (Dow Jones Industrial Average) trends. The release of news, particularly economic indicators, corporate announcements, geopolitical events, and market-related developments can profoundly impact the DJI and its price movements. Here's an overview of the impact of news on DJI trends:
● Economic Indicators: News related to economic indicators, such as GDP growth, employment figures, inflation rates, interest rates, and consumer sentiment, can significantly influence DJI trends. Positive economic news often increases investor confidence, driving the DJI higher. Conversely, negative economic news can trigger concerns, leading to a decline in the DJI.
● Corporate Announcements: Earnings reports, mergers and acquisitions, product launches, and other corporate announcements can affect DJI trends. Positive corporate news, like better-than-expected earnings or successful business strategies, drives the DJI upward. Conversely, negative information, such as profit warnings or legal issues, can cause the DJI to decline.
● Geopolitical Events: Geopolitical events, such as elections, trade disputes, policy changes, or conflicts, can have a significant impact on DJI trends. These events introduce uncertainty into the market and can cause volatility. Traders closely monitor geopolitical news as it can lead to sharp movements in the DJI, mainly when unexpected outcomes or shifts in global economic dynamics exist.
● Market-Related Developments: News related to market trends, central bank decisions, sector-specific developments, or regulatory changes can influence DJI trends. For example, a central bank's announcement of an accommodative monetary policy can boost investor sentiment and drive the DJI higher. Similarly, sector-specific news, such as technological breakthroughs or regulation changes affecting specific industries, can affect the DJI.
● Market Sentiment: News has the power to shape market sentiment, affecting DJI trends. Positive news can create a bullish sentiment, leading to increased buying activity and upward trends in the DJI. Conversely, negative news can generate a bearish sentiment, triggering selling pressure and downward trends in the DJI. Traders often monitor news sentiment indicators or sentiment analysis tools to gauge market sentiment.
The impact of news on DJI trends can be complex and may vary depending on the specific context and market conditions. Traders should consider a comprehensive approach that combines news analysis with technical analysis, fundamental analysis, and risk management strategies to make well-informed trading decisions.
Additionally, the interpretation and reaction to news can differ among market participants, contributing to market volatility and fluctuations in DJI trends.
Risks Associated with Trading Based on Historical DJI Trends
While trading based on historical DJI (Dow Jones Industrial Average) trends can provide valuable insights, it's essential to be aware of the risks associated with this approach. Here are some key risks to consider:
● Past Performance Does Not Guarantee Future Results: Historical DJI trends may not accurately predict future market movements. Economic, political, or other unforeseen events can disrupt historical patterns, rendering them less reliable. Traders should exercise caution and consider other forms of analysis to validate trends before making trading decisions.
● Market Volatility: Markets can be volatile, and price movements based on historical trends can be subject to sudden and unexpected changes. External factors like economic data releases, geopolitical events, or market sentiment shifts can trigger sharp reversals or breakouts, leading to losses if traders solely rely on historical DJI trends without considering current market conditions.
● False Signals: Historical DJI data may contain false or unreliable signals. Traders must differentiate between genuine trend reversals or continuations and temporary price fluctuations. Incorporating additional technical indicators, chart patterns, or fundamental analysis can help confirm the reliability of historical trends.
● Over-Optimisation: Traders may be tempted to perfect their strategies based on historical DJI data to maximise profits. However, excessive optimisation can lead to curve fitting, where the strategy becomes too specific to historical data and performs poorly in real-time trading. Balancing strategies and ensuring they are robust enough to adapt to changing market conditions is essential.
● Risk of Missed Opportunities: Relying solely on historical DJI trends may cause traders to miss emerging trends or market shifts. By focusing exclusively on the past, traders may overlook new developments or fail to adapt their strategies to evolving market dynamics. Incorporating real-time data, news, and other relevant information is crucial to find emerging opportunities and adjusting trading approaches accordingly.
● Timing and Execution Risks: Timing the entry and exit points accurately based on historical DJI trends can be challenging. Traders may experience delays in executing trades or face slippage, where the executed price differs from the expected price due to market fluctuations. These factors can affect profitability and the overall effectiveness of trading strategies.
● Emotional Biases: Emotional biases, such as overconfidence, fear, or greed, can influence trading decisions based on historical DJI trends. Traders may become overly confident when historical trends align with their positions, leading to impulsive or irrational trading choices. It's crucial to remain disciplined, adhere to risk management principles, and avoid emotional biases when using historical trends for trading.
To mitigate these risks, traders should consider an integrated approach to trading that incorporates multiple forms of analysis, risk management strategies, and ongoing evaluation and adaptation. Traders can make more informed and robust trading decisions by combining historical DJI trends with other indicators, staying updated with real-time market data, and practising prudent risk management.
Frequently Asked Questions on Historical DJI Data Analysis
Here are some frequently asked questions (FAQs) on historical DJI (Dow Jones Industrial Average) data analysis:
● What is historical DJI data analysis? Historical DJI data analysis involves studying past price movements, trends, patterns, and indicators of the Dow Jones Industrial Average to gain insights into market behaviour and make informed trading decisions.
● How can I access historical DJI data? Historical DJI data can be accessed through various financial data providers, market research platforms, or online financial databases. These sources offer historical price charts, open, high, low, and close (OHLC) data, and other relevant information for analysis.
● What are the key components of historical DJI data? The key elements of historical DJI data include date and time stamps, opening price, highest price, lowest price, closing price, trading volume, and sometimes additional data like adjusted close for dividends or stock splits.
● What tools or software can I use to analyse historical DJI data? There are several tools and software options available for analysing historical DJI data, such as Excel, Python's libraries (e.g., pandas, NumPy), statistical software like R, charting platforms like TradingView, or specialised trading software like MetaTrader or TradeStation.
● How can I identify trends from historical DJI data? Trends can be found by visually inspecting historical DJI price charts, plotting trendlines, or using technical indicators like moving averages. Uptrends show higher highs and higher lows, while downtrends exhibit lower highs and lower lows.
● What are some common technical indicators used in historical DJI data analysis? Common technical indicators used in historical DJI data analysis include moving averages, relative strength index (RSI), stochastic oscillator, MACD (moving average convergence divergence), Bollinger Bands, and Fibonacci retracement levels.
● How can I back-test trading strategies using historical DJI data? Back-testing involves applying trading strategies to historical DJI data to evaluate their performance. Traders can manually back-test using Excel or specialised back-testing platforms like MetaTrader, TradeStation, or NinjaTrader, which provide historical data and simulated trading environments.
● What are the limitations of historical DJI data analysis? Historical DJI data analysis has limitations, including the inability to predict future market movements with certainty, the impact of unforeseen events on historical patterns, the risk of false signals, and the potential for over-optimisation. Traders should exercise caution and consider other factors alongside historical data.
● How far back does historical DJI data typically go? Historical DJI data can vary depending on the source but typically extends several decades. Data providers and platforms often offer daily, weekly, or monthly data going back several years or even decades.
● Can historical DJI data be used for long-term investment strategies? Yes, historical DJI data can be used for long-term investment strategies. Investors can make informed decisions about their portfolios and investment allocations based on historical DJI data by analysing long-term trends, patterns, and fundamental factors.
Although historical DJI data analysis can be informative, combining it with other forms of research is essential, remaining updated with real-time market information and exercising proper risk management to make well-informed trading or investment decisions.
Key Metrics to Track when Analysing DJI Data
When analysing DJI (Dow Jones Industrial Average) data, there are several key metrics that traders and investors can track to gain insights into market trends and make informed decisions. Here are some important metrics to consider:
● Price: Tracking the DJI's price over time is fundamental. It provides a clear picture of the market's overall direction and helps find trends, support and resistance levels, and potential reversal points.
● Daily/Weekly/Monthly Returns: Calculating and monitoring the DJI's returns on a daily, weekly, or monthly basis helps assess the rate of price change. Returns indicate the profitability of investments and can highlight periods of market volatility.
● Volume refers to the number of shares or contracts traded during a given period. Tracking volume alongside price movements helps determine the level of market participation and confirm the strength of trends. Higher volume often confirms the validity of price movements.
● Market Breadth: Market breadth measures the number of advancing and declining stocks within the DJI. Breadth indicators like the advance-decline ratio or the number of stocks above or below certain moving averages provide insights into the market's overall health. They can help find overbought or oversold conditions.
● Volatility: Volatility measures the degree of price fluctuations in the DJI. Metrics like the average true range (ATR) or the VIX (Volatility Index) can help assess market volatility and show periods of heightened risk or potential trading opportunities.
● Correlations: Examining correlations between the DJI and other market indices, sectors, or individual stocks can provide insights into broader market movements. Positive correlations suggest comparable price movements, while negative correlations indicate divergent behaviour.
● Moving averages are trend-following indicators that smooth out price fluctuations and help identify support and resistance levels. Popular moving averages to track will include the 50-day, 100-day, and 200-day moving averages.
● Oscillators: The relative strength index (RSI), stochastic oscillator, or MACD (moving average convergence divergence) help identify overbought or oversold conditions in the DJI. These indicators can show potential reversals or confirm the strength of trends.
● Market Sentiment: Monitoring market sentiment through indicators like the put-call ratio, investor sentiment surveys, or news sentiment analysis provides insights into market participants' overall mood and sentiment. It can help gauge market sentiment extremes or potential turning points.
● Economic Indicators: Keeping an eye on relevant economic indicators, such as GDP growth, employment figures, inflation rates, or central bank decisions, can help understand the broader economic context in which the DJI operates. Economic indicators can affect market sentiment and influence DJI trends.
By tracking these key metrics, traders and investors can better understand DJI trends, market dynamics, and potential trading opportunities. Combining these metrics with other forms of analysis, risk management strategies, and market news is essential to make well-informed decisions.
Compare Different Periods of DJIA Data
Comparing different time periods of DJIA (Dow Jones Industrial Average) data can provide valuable insights into market trends, volatility, and performance over specific durations. Let's compare three standard time periods: short-term, medium-term, and long-term.
- Short-term (e.g., daily or weekly data): Short-term analysis focuses on recent price movements and helps find intraday or short-term trading opportunities. Traders often use shorter time periods to spot patterns, support and resistance levels, and momentum indicators. It helps capture near-term market sentiment and volatility. Short-term analysis may highlight short-lived trends or market fluctuations driven by news events or technical factors.
- Medium-term (e.g., monthly or quarterly data): Medium-term analysis spans several months or quarters and provides a broader view of market trends. It helps identify intermediate trends and significant price levels. Traders and investors use medium-term analysis to identify longer-lasting patterns, such as chart formations or trend reversals. This timeframe is suitable for swing trading or position trading strategies. It allows for a more comprehensive analysis of fundamental factors, economic indicators, and market sentiment over a reasonable time horizon.
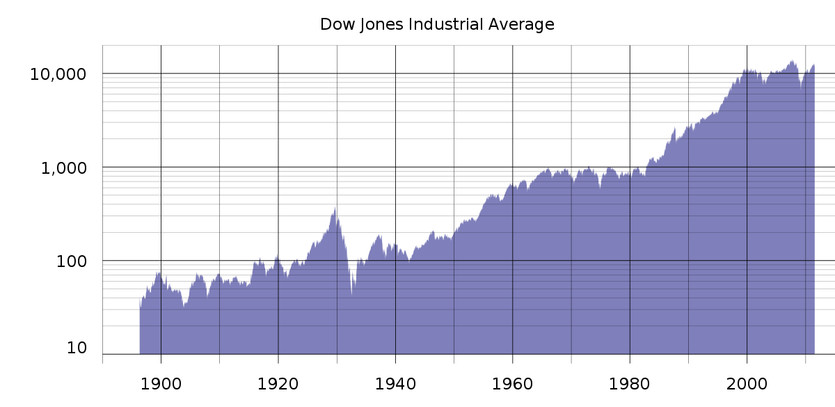
- Long-term (e.g., yearly or multi-year data): Long-term analysis encompasses several years or decades of DJIA data. It offers insights into long-term market cycles, major trends, and historical market behaviour. Long-term analysis is crucial for understanding the market's overall direction and finding secular bull or bear markets. It helps formulate long-term investment strategies and find key support and resistance levels. Long-term analysis is often used by buy-and-hold investors, pension funds, or those focusing on retirement planning.
By comparing these different periods, traders and investors can comprehensively view the DJIA's behaviour, trends, and potential investment opportunities. Short-term analysis is helpful for tactical trading decisions, medium-term analysis helps with trend identification and strategy development, and long-term analysis aids in understanding the market's historical context and long-term investment planning.
It's important to note that each period has limitations and may require different analytical tools and approaches. Traders and investors should use a combination of technical analysis, fundamental analysis, risk management strategies, and market news to make informed decisions across various timeframes.
Historical DJIA Data vs Other Indices and Stocks
Comparing historical DJIA data with other indices and individual stocks can supply valuable insights into relative performance, market correlations, and investment opportunities. Here are some key points to consider when comparing historical DJIA data with other indices and stocks:
● Market Performance: Analysing historical DJIA data alongside major indices like the S&P 500, NASDAQ Composite, or Russell 2000 can reveal broader market trends and overall market sentiment. By comparing the performance of the DJIA with these indices, traders can assess the relative strength or weakness of the market.
● Sector Analysis: Comparing the historical performance of the DJIA with sector-specific indices or ETFs can help identify sector rotations or trends. By analysing how specific sectors outperform or underperform the overall market, traders can find opportunities for sector-specific investments or diversification strategies.
● Individual Stocks: Comparing the historical performance of individual stocks within the DJIA can help show outliers, strong performers, or underperformers. By comparing individual stocks' price movements, trends, and volatility with the DJIA, traders can spot potential trading opportunities or assess the strength of specific companies within the broader market.
● Correlations: Analysing the historical correlations between the DJIA and other indices or stocks can provide insights into market relationships and diversification opportunities. Positive correlations suggest relative price movements, while negative correlations indicate divergent behaviour. Understanding correlations can help traders assess risk and construct well-diversified portfolios.
● Market Breadth: Assessing market breadth indicators, such as the advance-decline ratio or the number of stocks above or below certain moving averages, can reveal the overall health of the market and the participation of individual stocks in market trends. Comparing market breadth indicators across different indices and stocks can provide insights into market breadth divergences or confirmations.
● Relative Strength: Comparing the relative strength of individual stocks or sectors against the DJIA can help show outperformers or areas of potential investment. Relative strength analysis helps assess which stocks or sectors perform better or worse than the broader market, offering insights into possible trading or investment opportunities.
When comparing historical DJIA data with other indices and stocks, traders should consider the specific timeframes, data quality, and the impact of dividends, stock splits, or other corporate actions. Additionally, other factors like company-specific news, earnings reports, or geopolitical events may influence the performance of individual stocks, which should be considered during analysis.
The Future of Historical DJIA Data Analysis
The future of historical DJIA (Dow Jones Industrial Average) data analysis will likely be shaped by technological advancements, data accessibility, and analytical techniques. Here are some potential trends and developments to consider:
● Big Data and Machine Learning: With the increasing availability of vast amounts of financial data, including historical DJIA data, big data analytics and machine learning algorithms will play a crucial role in extracting insights and patterns. These technologies can find complex relationships, uncover hidden trends, and enhance predictive modelling capabilities, enabling traders and investors to make more informed decisions.
● Advanced Visualisation Tools: Interactive and visually appealing data visualisation tools will continue to evolve, making it easier for users to explore historical DJIA data and gain insights quickly. These tools will provide customisable charts, graphs, and dashboards that enable users to find patterns, compare multiple time periods, and visualise correlations between DJIA and other variables.
● Integration of Alternative Data Sources: Besides traditional historical price and volume data, integrating alternative data sources will become more prevalent. This includes incorporating sentiment analysis from social media, news sentiment data, satellite imagery, web scraping, and other non-traditional data sources. By combining these sources with historical DJIA data, traders can gain a broader understanding of market dynamics and potentially identify unique trading opportunities.
● Real-time Data Analysis: Real-time data analysis will become increasingly important in historical DJIA data analysis. Traders will have access to up-to-the-minute market data, allowing for faster identification of trends, patterns, and market shifts. Real-time analysis will enable more agile trading strategies and better risk management in rapidly changing market conditions.
● Artificial Intelligence (AI) in Trading: AI-powered trading algorithms will continue to evolve, leveraging historical DJIA data to develop sophisticated trading strategies. AI models can analyse historical data, find complex patterns, and adapt to changing market conditions. AI-based trading systems may become more common, automating trade execution and improving performance based on historical trends.
● Regulatory Changes and Data Accessibility: Regulatory changes may affect data accessibility, especially regarding historical market data. Increased regulatory scrutiny on data privacy, market transparency, and access to historical data could influence how traders and investors can access and utilise DJIA data. Staying informed about regulatory developments affecting historical data analysis will be necessary.
Unforeseen technological advancements, market developments, and regulatory changes will also shape the future of historical DJIA data analysis. Traders and investors should stay informed, embrace continuous learning, and adapt their analytical approaches to leverage the evolving landscape of historical DJIA data analysis.
Key Takeaways for Traders
Analysing historical DJIA data can provide valuable insights for traders. Here are some key takeaways to keep in mind:
● Identify Trends: Analysing historical DJIA data helps traders find trends and patterns, such as uptrends, downtrends, or consolidation phases. This information can guide trading decisions and help traders capitalise on potential market movements.
● Utilise Technical Analysis: Technical analysis tools and indicators, such as moving averages, oscillators, and chart patterns, can be applied to historical DJIA data to uncover potential entry and exit points. These tools provide valuable signals for traders to make informed trading decisions.
● Back-test Strategies: Historical DJIA data can be used to back-test trading strategies. By applying trading rules to past data, traders can evaluate the performance and profitability of their strategies. Back-testing helps traders refine their approaches and identify strategies that have worked well in different market conditions.
● Use Analytics Tools: Various analytics tools and software, such as Excel, Python libraries (e.g., pandas), statistical software like R, or specialised trading platforms like MetaTrader or TradeStation, can aid in analysing historical DJIA data. These tools offer data manipulation capabilities, charting options, and technical indicators to enhance analysis.
● Consider News Impact: Historical DJIA data analysis should be complemented with an understanding of the impact of news events on market trends. Major news announcements, economic indicators, and geopolitical events can significantly influence the DJIA's performance. Traders should stay informed and adapt their strategies accordingly.
● Manage Risks: Trading based on historical DJIA data carries risks. Traders should exercise proper risk management techniques, including setting stop-loss orders, managing position sizes, and diversifying their portfolios. Risk management helps protect against potential losses and maintains a sustainable trading approach.
Resources and Tools for Historical DJIA Data Analysis
- Financial Data Providers: Use reputable financial data providers like Bloomberg, Yahoo Finance, or Google Finance to access historical DJIA data and related market information.
- Charting Platforms: TradingView, StockCharts.com, and other charting platforms offer comprehensive charting tools and historical data analysis capabilities.
- Analytics Software: Employ software like Excel, Python, or statistical software like R for in-depth data analysis and manipulation.
- Back-testing Platforms: Platforms like MetaTrader, TradeStation, or NinjaTrader provide historical data and simulated trading environments for back-testing trading strategies.
- News and Economic Data Sources: Stay updated with information and economic data from reputable sources like CNBC, Bloomberg, or economic calendars to understand the broader market context and news impact on DJIA trends.
Historical DJIA data analysis is just one tool in a trader's toolkit. It should be combined with other forms of analysis, risk management techniques, and market monitoring to make well-informed trading decisions.
Continuously learning and adapting strategies based on historical data insights can help traders navigate the dynamic landscape of the DJIA and potentially improve trading performance.