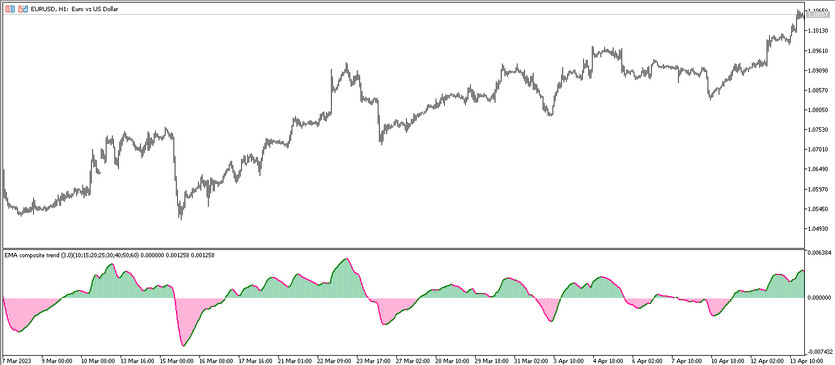
The Averages Composite Trend trading tool is an algorithmic indicator developed around multiple moving averages of various durations. It is tailored to evaluate the prevailing market trend, its orientation, and vigor, thereby identifying optimal moments for initiating trades within a given timeframe. The histogram and signal line of the indicator, located at the bottom pane of the price chart, illuminate the current market trend through color changes and directional shifts, either above or below the signal level. These elements assist in deciphering market behavior and identifying prime market entry points.
The Averages Composite Trend indicator exhibits consistent performance across all currency pairs and timeframes, thus offering flexibility in your selection.

Indicator Settings
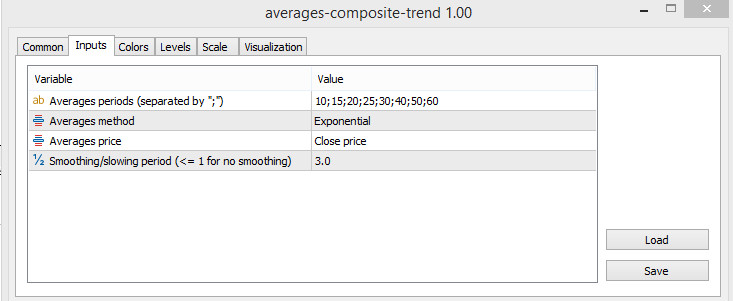
The configurations for the Averages Composite Trend indicator are categorized into different segments. The primary segment is the Input Parameters, which manages the technical operations and general functioning of the indicator. The Colors segment caters to the color scheme and overall visualization adjustments, and the Levels segment introduces additional signal levels into the indicator window.
- "Averages periods (separated by ";")" refers to the periods of the incorporated moving averages for indicator calculations. The standard configuration is 10;15;20;25;30;40;50;60.
- "Averages method" pertains to the procedure for smoothing the moving averages used in the calculations.
- "Averages price" indicates the price type used in the calculations, with Close price as the default.
- "Smoothing/slowing period (<=1 for no smoothing)" signifies the period for smoothing or decelerating the calculations. The preset value is 3.0, whereas a value <=1 signifies no smoothing.

Indicator Signals
The Averages Composite Trend trading tool operates similarly to other histogram indicators. To initiate a trade, the strength and orientation of the prevailing market trend need to be determined. The histogram direction, color, and position relative to the signal level help ascertain whether the market is bullish or bearish. In a bullish trend, traders open long positions, while a bearish trend prompts short positions. Trade closure occurs when the market direction shifts.
Signal for Buy Trades:
- The histogram and signal line turn green and ascend above the 0 level. The subsequent histogram column must exceed the preceding one. In this scenario, a buy trade can be initiated due to a strong bullish trend. The trade is closed when the histogram changes color and direction, indicating a possible trend reversal.
Signal for Sell Trades:
- The indicator turns red and descends below the signal level, forming a new column lower than the previous one. This condition indicates a bearish trend and a sell trade can be initiated. The trade is closed when the trend shifts, evident from the change in the indicator's color and direction.
Conclusion
The Averages Composite Trend indicator is highly efficient due to its calculations grounded on the synergy of trading algorithms with proven accuracy. It is advisable to test the indicator on a demo account before using it on a live trading account.


