
Introduction to the PCE Price Index
The Personal Consumption Expenditures (PCE) Price Index, a pivotal tool for assessing inflation and spending patterns in the U.S., is diligently tracked and reported by the Bureau of Economic Analysis (BEA) every month. This index captures the volatile nature of goods and services pricing, which continually fluctuates in response to shifting economic trends.
The PCE Price Index gauges the American inflation rate by tracking changes in the cost of living for households. It carefully monitors the prices of a diverse basket of goods and services, giving different weightings to each based on their relevance to a typical household's monthly expenditure.
For instance, if gasoline prices increase in a specific month while tomato prices decline, the PCE gives more weight to gasoline due to its significant role in a household's monthly budget. Therefore, the rise in gasoline prices will impact the overall index more significantly than the drop in tomato prices.
The Role of the PCE Price Index in Measuring U.S. Inflation
Among the three main U.S. inflation measures - the PCE Price Index, the Consumer Price Index (CPI), and the Producer Price Index (PPI) - the PCE is particularly noteworthy for several reasons:
- The Federal Reserve considers the PCE Price Index as its primary measure of U.S. prices, making it a key player in determining interest rate policies.
- The data for the PCE Price Index originates from business surveys rather than consumer-reported spending. This method ensures that PCE captures expenditures made on behalf of consumers, such as employer-paid health insurance or government assistance programs.
- The selection of goods and services within the PCE basket is regularly updated to reflect substitution. When the price of an item increases, consumers shift their spending to cheaper alternatives, and the PCE basket incorporates these changes.
The Latest Figures of PCE Inflation
The most recent PCE price index data, published on July 28, 2023, showed an inflation figure of +3.0% year over year for June, a substantial decrease from May's annual rate of 3.8%. This number is less than half of the peak rate of 6.9% observed in June 2022.
How the PCE Inflation is Calculated
The PCE Index calculation relies on BEA data from various sources, including statistical reports from U.S. Census Bureau and other government agencies, administrative and regulatory agency reports, and reports from private organizations such as trade associations.
The BEA organizes consumer goods and services into three categories:
- Durable goods: Items with a lifespan of three years or more, like cars, furnishings, and recreational goods.
- Non-durable goods: Items with a lifespan of less than three years, like food, clothing, and gasoline.
- Services: Categories like housing, healthcare, recreation services, and financial services.
The PCE inflation rate is derived by adding the dollar values of all goods and services in the basket, and then comparing this total to the previous month's figures.
Using the PCE Price Index in Investment Decisions
1. Analyzing Economic Trends
The PCE Price Index helps investors understand the overall direction of the economy. A rising PCE may suggest that the economy is experiencing inflation, whereas a falling PCE could indicate deflation. This understanding can help investors position their portfolios in assets that can potentially benefit from these economic conditions.
2. Interest Rate Predictions
The Federal Reserve uses the PCE Price Index as its preferred inflation gauge. Therefore, changes in the PCE can hint at future monetary policy shifts, including changes in interest rates. For instance, a consistently high PCE may lead to higher interest rates to curb inflation. Higher interest rates could impact bond yields and the borrowing costs for companies, thus influencing the stock and bond markets.
3. Sector Selection
Investors can use the PCE Price Index to identify which sectors might benefit from current or expected inflation trends. For example, during periods of high inflation, tangible assets like commodities or real estate may outperform. Conversely, in periods of low inflation or deflation, bonds and high-dividend stocks may offer better returns.
4. International Investing
The PCE Price Index is a measure of U.S. inflation and consumer spending. Still, it can also impact global markets, especially in economies closely tied to the U.S. International investors can use this index to gauge the health of the U.S. economy and make investment decisions accordingly.
Core Inflation vs. Headline Inflation
Inflation statistics are typically released in pairs: headline inflation and core inflation. While headline inflation accounts for every good or service in an index, core inflation excludes volatile food and energy prices.
Core PCE plays a pivotal role in the U.S. financial system as the Federal Reserve uses it as an inflation gauge for setting monetary policies. The Federal Open Market Committee (FOMC) chose PCE over CPI for several reasons, including PCE's regular basket adjustments and more comprehensive coverage of goods and services.
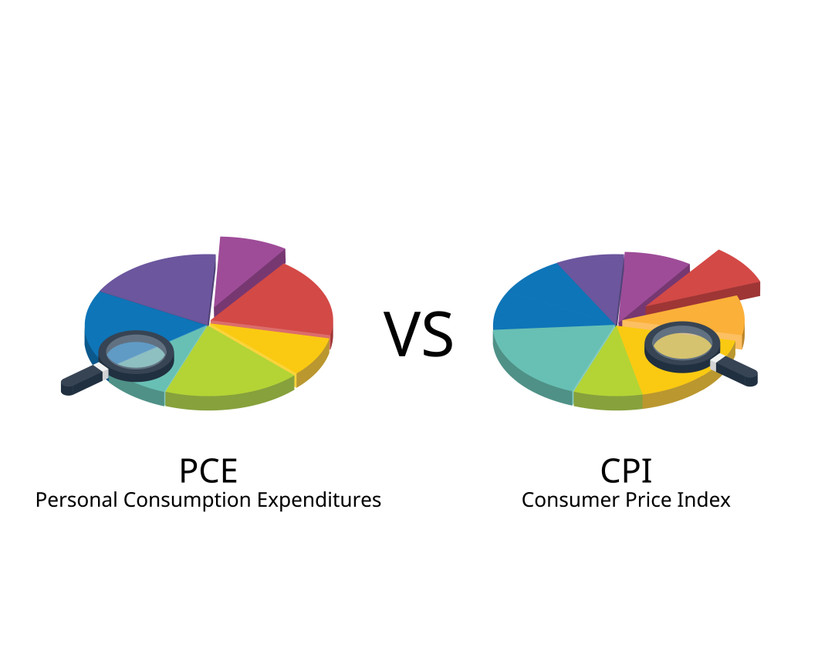
PCE vs CPI: Highlighting the Difference
Despite the CPI and the PCE Index's shared aim of tracking U.S. inflation, they approach this goal differently. While both monitor changes in a basket of goods and services, CPI data comes from consumer surveys, while PCE relies on business reports. Consequently, CPI is more volatile and less comprehensive than PCE. Moreover, CPI rates of inflation tend to be higher than those of the PCE Index.