US Dollar Fundamental Outlook: How Far Can USD Fall in Defiance of Strong Data?
The US dollar traded lower for a second week and is falling further into the new trading week. The decline, at least its degree, was not anticipated by many, particularly because it came in the face of robust economic data throughout the week. Retail sales came in at a healthy 9.8% compared to the 5.8% forecasts, while CPI inflation (March data) surged to 2.6% from 1.7% in February.
The robust US reports were already discounted by markets and largely expected, explaining the frail USD reaction to an extent. Retail sales were supported by Biden’s stimulus checks, while y/y inflation is getting a boost from oil base effects (due to the sharp decline this time last year).
Both the markets and the Fed expect the higher inflation to be transitory, and Biden’s cash handouts will end next month. Hence the Fed can still remain comfortably dovish and keep QE stimulus running for a while longer. However, it’s hard to argue against the fact that the US economy is indeed running a little hotter than its European and other counterparts. This should put the Fed ahead in the tightening race, which may begin as soon as late this year with central banks starting to wind down quantitative easing stimulus. If the Fed leads the tightening race again (like following the 2008 crisis in the period 2014-2019), then the US dollar will be in a good spot to remain relatively strong, at least on a short to medium-term horizon (during this summer and maybe into autumn).
This week’s US calendar is quiet with no major economic releases scheduled. Traders may instead start to prepare for next week’s pivotal Fed meeting, where they will seek answers regarding the Fed’s new AIT (average inflation targeting) regime and how it connects to last week’s surge in the CPI report. In the meantime, the USD may stay soft, or perhaps more likely, range-bound.
Euro Fundamental Outlook: Big Week for EUR with Two Events in Focus
While the dollar was on a clear downward trajectory, the euro’s and other currencies’ direction was more mixed last week. The EUR calendar starts off the week slowly and will then get busier on Thursday and Friday. The ECB meeting and the Eurozone’s preliminary services and manufacturing PMI surveys will be front and center in the Fx market.
While the ECB will steal the central focus, they aren’t likely to announce major adjustments or changes to policy. The ECB will probably save any big decisions for the June meeting, by when vaccinations in the EU should allow a reopening from Covid restrictions to begin. Still, traders will closely watch the choice of words of President Lagarde during the post-meeting presser, during which we are likely to see higher volatility in EUR pairs.
The flash services and manufacturing PMIs will be released on Friday, and perhaps, will be as important as the ECB meeting. Strong numbers are expected here, especially for the manufacturing sector which wasn’t hit as hard from the pandemic but is benefiting from fiscal stimulus.
With the EUR currency making a notable recovery recently, it seems this week could be an inflection point. The overall takeaways (bullish/bearish) from the ECB and the PMIs can potentially decide where the euro will trade in the next 3-4 weeks. On balance, the probabilities look tilted to the downside for the single currency.
EURUSD Technical Outlook:
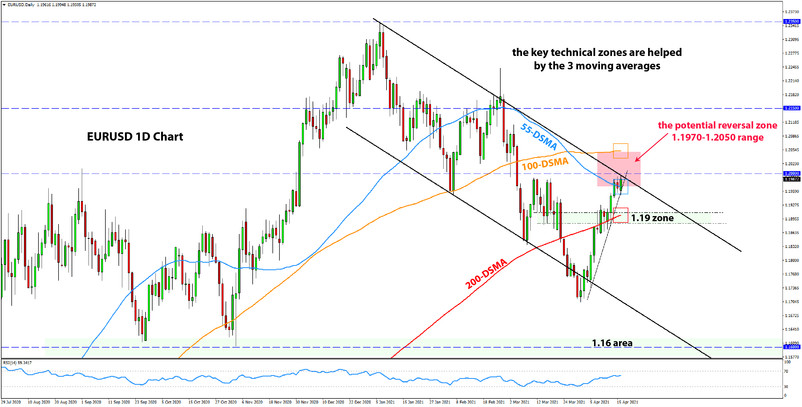
EURUSD progressed higher and is testing ground above the 1.20 level on the first day of the new week. Other than this, not a lot has changed in the EURUSD’s technical picture. As we said in last week’s analysis, the 1.20 resistance area is a strong one and can stretch as high as 1.2050 and even 1.21 before we see a reversal.
The price almost reached the 1.2050 level this morning, but we are now down on what is a modest rejection so far. The bears would want to see a swift move back below 1.20 to regain their confidence that the top is behind. On the other hand, a move above 1.21 would open up further upside potential, with the next resistance zones standing at 1.22 and 1.23.
If the 1.20 area holds, then the bears would be looking at the 1.19 level as the nearest support to the downside. Below it, there is a 200-pip “free space” with no support until the 1.17 lows from the turn of the month.
British Pound Fundamental Outlook: Busy UK Calendar Ahead; Will It Be Bearish or Bullish for GBP?
Last week we said that the British pound needs a new catalyst to re-establish the bullish trend from earlier this year. With a busy calendar ahead of us, perhaps this week could be when GBP starts to rally again.
In a usual format, the employment reports, CPI inflation, retail sales, and the services and manufacturing PMIs will be released all in the same week. Consensus forecasts are predicting improvements across the board for almost all of these data pieces. If this is proven correct, then GBP will likely find a bid and break out of its recent consolidation. This should probably be enough to take GBPUSD above 1.40 and EURGBP toward 0.85.
On the vaccination front, the UK continues to lead the way, delivering around half a million shots per day. The second doses are now making a large majority of them, which should result in more than 30 million fully vaccinated people by the end of May, setting the stage for the lifting of restrictions in June.
GBPUSD Technical Outlook:
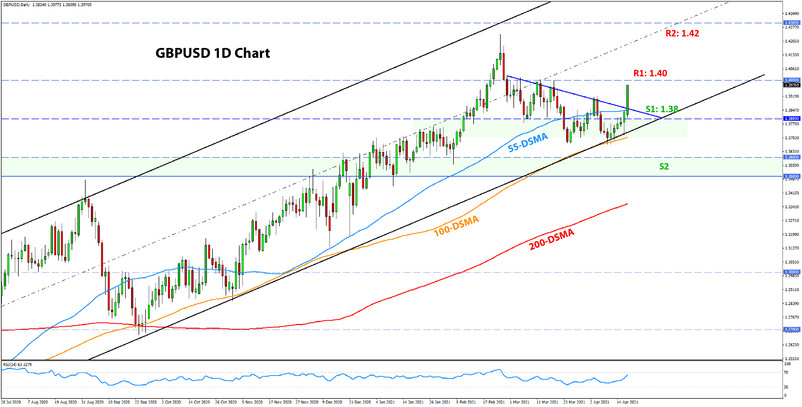
Much as we anticipated, the 1.37 - 1.38 support area held off the retracement, and GBPUSD is now breaking to the upside. The acceleration came after this morning’s breakout above the falling retracement trendline (around the 1.3850 level).
The 1.40 level is now within reach, where cable should meet the next resistance zone. However, while 1.40 is an important psychological level, it’s questionable if it will prove a pivotal resistance zone in the current context. Specifically, there is no other technical factor to aid the resistance here, so the pair may as well go a tad higher before encountering a stronger pushback.
Above 1.40, traders will have their eyes on the 1.42 area and the February highs. If the bulls go through 1.40 easily, then the big resistance will probably be waiting at this 1.42 area.
Japanese Yen Fundamental Outlook: JPY’s Bounceback Continues
The yen strengthened against the US dollar in tandem with other currencies last week, while it remains range-bound versus the other major currencies. The decline in US yields in the past few weeks is behind a large part of the dollar’s decline, and probably that is most evident against the yen on the USDJPY pair.
If you remember, in our recent weekly analysis posts, we highlighted the fact that 10-year US Treasury yields are at a major monthly resistance area, where a reversal was possible. That seems to be happening now and is playing to the JPY’s benefit. If not more, at least it will be a “healthy” relief after JPY’s pronounced decline in March.
Other than the yields story, overall risk sentiment will continue to be a driver for the Japanese yen. On that front, stocks remain near all-time highs but look quite toppish (e.g., S&P 500). Perhaps a meltdown in stocks is not so hard to imagine at these levels?
USDJPY Technical Outlook:
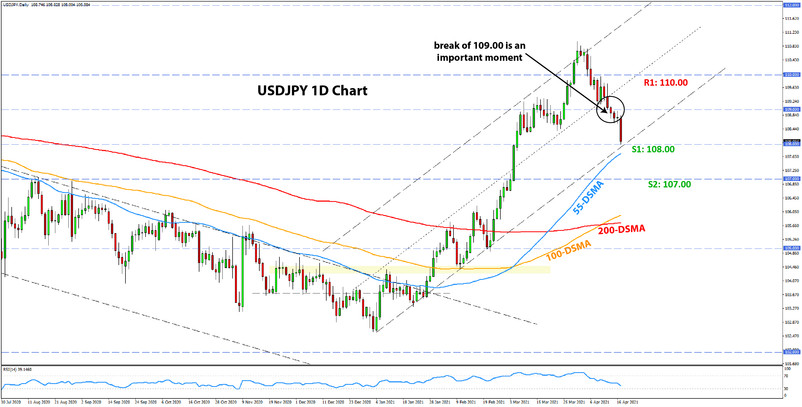
Last week, we said that 109.00 was a critical support zone that needs to hold to keep the uptrend alive. But USDJPY broke it and has now reached the 108.00 level. While the uptrend is not completely dead yet, the probabilities are much higher now that we are below the 109.00 confluence support.
Below 108.00, there is little to stop the price from reaching 107.00. And, if USDJPY reaches 107.00 and closes the month of April there (which will be likely under such a scenario given we are nearing the month’s end), it will complete a full reversal of the March rally. Moreover, this will create a bearish engulfing candlestick pattern on the monthly chart, following the rejection at the 110.00 resistance area. Such a scenario will turn the monthly USDJPY technicals bearish.
Looking at an optimistic scenario, this 108.00 support could hold and then lead USDJPY above 109.00. Hence it seems, how USDJPY reacts with this 108.00 support here is also very important. Below we show the shorter-term picture of the daily chart and the ascending channel that defined the rally there. While no significant buying pressures can be drawn on the channel’s support here, there are some confluences worth noting (such as the 55-DMA).
