US Dollar Fundamental Outlook: Watching GDP and PCE Inflation This Week
The dollar extended the decline and reached a new 4-month low last week. Although the weekly close was off the lows, the extension of the downtrend shows that the bears are still in control of the trend here.
Last week’s uninteresting economic calendar did not give many reasons for exciting action, and most major USD pairs traded in compressed ranges. Of note was the bullish USD reaction to the FOMC meeting minutes, which revealed that several Fed policymakers were ready to talk about tapering. Still, the move was quickly reversed thereafter, indicating the market’s preference to sell dollars in the current environment.
The main question that investors care about right now is whether the coming inflation spike is transitory or not, and how the Fed would respond with policy to the different scenarios. Any hawkish change at the Fed ought to be hugely positive for the dollar and can be the force that will reverse the ongoing downtrend. But as long as the Fed stays silent on the “inflation issue”, traders will keep selling dollars and the downtrend will likely remain intact.
The USD calendar this week features the release of CB consumer confidence, GDP, the PCE index, trade balance, consumer sentiment, and the Chicago PMI. The main attention will go to the preliminary GDP data and the PCE inflation reports, where investors will watch how the latest numbers of growth and inflation relate. Q/Q GDP is expected at 6.5%, where positive surprises could prove supportive for the dollar. At the same time, if PCE inflation spikes higher like the CPI data earlier this month, it may lead to another “inflation scare” reaction, which would see the USD dumped.
Euro Fundamental Outlook: Should Friday’s Sell-Off After Stronger PMIs Concern EUR Bulls?
The euro currency recorded another mixed week of trading, ending marginally higher or unchanged versus other major currencies. Investors are turning optimistic on the euro again as vaccinations are going smoothly in the Eurozone, and a strong economic rebound is expected to follow once Covid restrictive measures are lifted.
That being said, there are still many uncertainties on the horizon, and the actual economic data can surprise positively or negatively. For example, last week’s Eurozone data was largely stronger than forecasts, including the closely-watched PMIs, yet, the euro was sold post the PMI release on Friday. This does not resemble the typical development in a bull EUR market. Usually, in EUR bull markets, the uptrend should extend when Eurozone PMI data beats expectations. Perhaps EUR bulls have a cause for concern at this juncture?
Still, the EUR will continue to receive some support from a weak dollar as long as the Fed keeping stimulus in full gear while inflation is surging. The EUR calendar is relatively light this week, notably featuring only the German Ifo report tomorrow and French preliminary CPI and GDP on Friday.
EURUSD Technical Analysis:
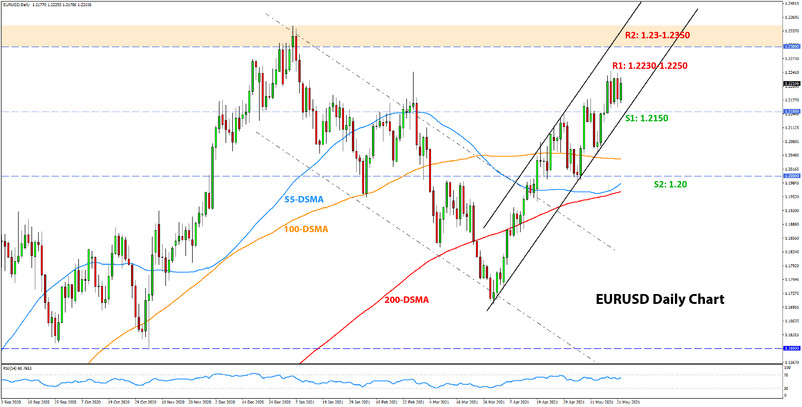
EURUSD continued to climb higher last week, though the pace has slowed. As can be seen from the daily chart, instead of progressing firmly higher, the pair has entered a range after reaching a new cycle high of 1.2244. This is potentially a warning sign for the bulls, especially that it comes coupled with two consecutive bearish evening star candle patterns (formed by the two red candles).
Nonetheless, EURUSD remains inside of the bullish channel, and as long as that is the case, the technicals will remain bullish. This makes the 1.2150 support of the channel particularly important, as it must hold in order for the bullish trend to stay unharmed. The bulls are looking toward the yearly highs around 1.2350 as their next target. This is also where the next important resistance for the pair lies.
If, on the other hand, if the 1.2150 support breaks, it will signal a trend reversal, with the 1.20 psychological zone coming in focus as the next key support.
British Pound Fundamental Outlook: A lot of the Good News Is Already in GBP’s Price
The pound sterling continued to grind higher last week, as employment and consumer spending data showed the recovery is going apace. The unemployment rate declined to 4.8%, while retail sales and the manufacturing PMI surprised massively to the upside. Still, despite the beat of expectations, GBP rallied only modestly and didn’t even manage to surpass the February high against the weak dollar.
The inability of the pound to rally further on confirmation of the strong economic recovery taking place suggests that a lot of this “good news” is already in the price of the currency. Indeed, GBP is one of the best performing major currencies this year, mainly driven by the UK’s speedy vaccination process and earlier reopening of the economy. But, other major economies are now catching up, and with GBP at these elevated levels, perhaps the time for a correction is not far?
The calendar this week is quiet, which means that GBP pairs will be left to be driven by broad market themes rather than domestic ones, as well as developments in other currencies.
GBPUSD Technical Analysis:
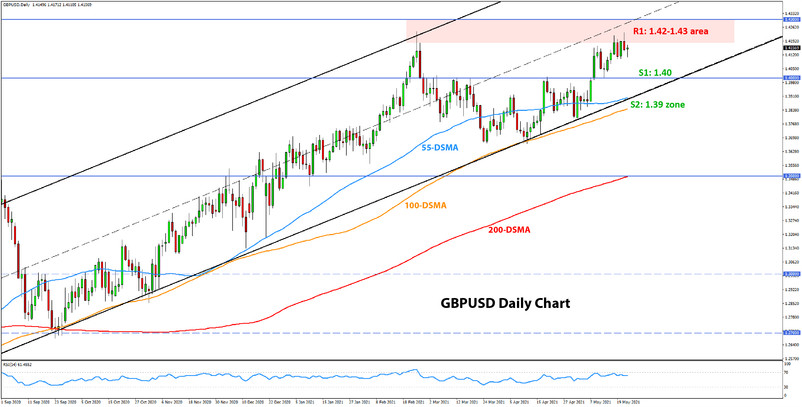
GBPUSD extended the move higher as part of the bullish channel inside of which it is trading for the past 12 months. Last week, it also reached the resistance from the February high at the 1.42 area, which could potentially give rise to a double top formation here. However, there is no bearish signal present on the daily chart at the moment; furthermore, such a potential double top would also need to be confirmed on the weekly chart to be valid.
For now, the focus remains on how GBPUSD behaves around the resistance here. A break above the 1.4240 February high and then above 1.43 is likely needed to unlock further gains. On the other hand, a move below 1.41 would signal that a top might be in place. In such a scenario, traders’ attention will turn to 1.40 and 1.39, which are the key support zones lower that would need to hold to keep the bull trend alive.
Japanese Yen Fundamental Outlook: Tracking the Dollar and US Yields
The Japanese yen continues to mainly track the US dollar against other currencies as the USDJPY pair remains firmly in a tight 100-120 pips range. USDJPY peaked a few pips under 111.00 on March 31, just as US yields did the same, and both are consolidating since then. The action in other JPY pairs over the past two months, therefore, has been a reflection of USD’s movements too and will continue to be as long as USDJPY is in a range.
The yen was the only currency that felt the heat from the crypto and stocks meltdown last week. But the JPY strength came in the hours just before the FOMC minutes last Wednesday, and USDJPY losses were reversed post the slightly hawkish FOMC minutes, essentially putting USDJPY back in its range. Whether the JPY’s reaction to the risk-off episode is a sign that the correlation is alive and well or not remains to be seen. With the S&P 500 now erasing all the losses, it’s no wonder maybe that JPY traders are not rushing to pull the trigger on any small decline in stocks.
USDJPY Technical Analysis:
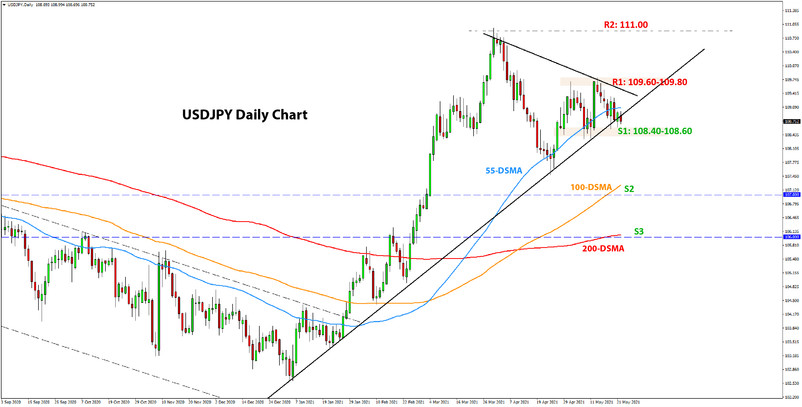
USDJPY is still meandering around the 109.00 level, without a clear break of the support here or a bounce higher. The actual levels for the short-term trading range are between 108.40-108.60 and 109.60-109.80.
The move below the 109.00 level and below the 55-day moving average (blue line) is an encouraging sign for the bears. Still, a bearish breakout below the 108.40-108.60 zone is needed to turn the technicals bearish here.
If USDJPY breaks below this 108.50 zone, the next support levels lower are around the 100-day 200-day moving averages, which stand at the 107.00 and 106.00 areas, respectively . To the upside, a break above the 109.60-109.80 resistance, and subsequently 110.00 also, would signal that the uptrend is resuming.
