US Dollar Fundamental Outlook: CPI Important This Week but Ranges Likely to Hold Into Sept 22 Fed Meeting
Last week’s modest recovery may make some traders think the USD uptrend is resuming; however, it’s better to not rush with any conclusions, especially ahead of the FOMC meeting next Wednesday (September 22). With such a crucial risk event only a week away and without any market-moving events this week, the dollar is more likely to be kept range-bound than make some meaningful breakouts.
The US calendar for the week ahead is relatively quiet, except for the CPI inflation report tomorrow (Tuesday). But market reaction to it may be muted too as markets prepare for the Fed meeting next week. Nonetheless, CPI inflation will be important as it has been in recent months because it’s one of the two primary factors the Fed watches when setting policy. That said, inflation is expected to decelerate further this month, which, if true, may inspire USD selling as the Fed will be under less pressure to taper QE stimulus. On the other hand, if CPI comes in hotter again, it could fuel a fresh wave of USD buying, with the dollar index (DXY) likely pushing higher above 93.00 and EURUSD pressing lower below 1.1750. Still, either outcome shouldn’t lead to moves much beyond these levels in either the DXY or EURUSD.
Fx traders will also watch the retail sales report and the Philadelphia Fed manufacturing index on Thursday, as well as the UoM Consumer Sentiment release on Friday.
Euro Fundamental Outlook: EUR Traders Unfazed by ECB’s PEPP Adjustment
The ECB slightly reduced the pace of PEPP purchases last week, but the market reaction was well-contained, and the EUR stayed in its pre-ECB ranges as traders were not surprised by this move. President Lagarde then made sure to clearly communicate that this is not tapering and that easy money will stay around for a long time. The euro is already finding itself falling again today as even the few unrealistic hopes for a hawkish shift at the ECB are being retracted.
The light EUR calendar for the week ahead features only 2nd tier events, whose market impact is likely to be minor to non-existent. That being the case, the euro is unlikely to make any meaningful breakouts this week either as the Fed meeting now looms as the most pivotal event of the month.
EURUSD Technical Analysis:
The last line of resistance at the head and shoulders neckline held last week. As we described in the previous weekly analysis, the point of failure for the H&S pattern was really a decisive close above 1.19. That did not happen, and in fact, EURUSD starts this week 100 pips down from this area.
Now, EURUSD may consolidate here for a while before more sustainably making a break, either higher or lower. For this week, we’ve marked a range on the chart between last week’s high around 1.19 and the 1.1750 level as support. Judging from the recent price action and the fundamental context, it looks probable that EURUSD will spend the current week between those two zones, 1.19 as resistance and 1.1750 as support.
In the bigger picture, 1.20 remains the key weekly resistance area, while 1.16 should be the nearest strong support area.
British Pound Fundamental Outlook: Let’s See If a Busy Calendar Can Excite More GBP Action
After three weeks of light calendar schedules, the British pound may see more action this week amid a much busier agenda. It is a big week for economic data that will surely influence thinking at the Bank of England and affect GBP exchange rates.
Jobs data will be reported on Tuesday in the form of the Claimant Count, earnings growth, and the unemployment rate. Then, CPI inflation will be published on Wednesday, which is expected to have accelerated in the UK to 2.9%. GBP traders will also watch the retail sales report on Friday.
Perhaps a combination of strong jobs reports with hotter CPI would be the bullish cocktail for GBP. However, on the other hand, weaker figures than expected will only add to last week’s GDP disappointment and could send GBP on a downward trajectory.
GBPUSD Technical Analysis:
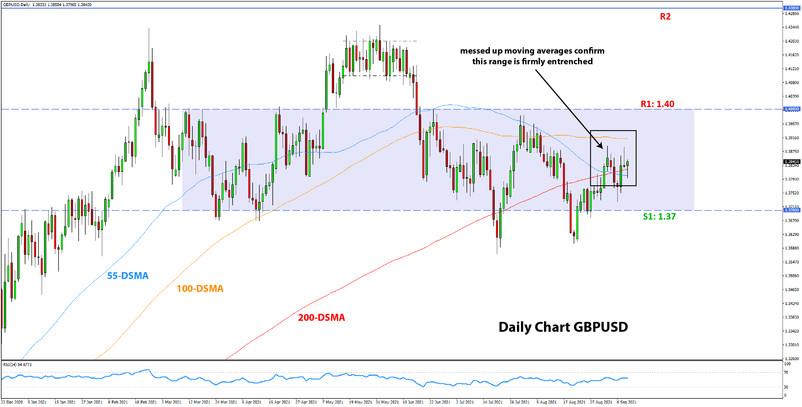
GBPUSD remains stuck mainly between 1.40 and 1.37 over the last 2-3 months, with no indication that a breakout is anywhere in sight. Hence this range (highlighted in purple on the chart), is our trading focus in the current environment.
The two levels noted – 1.40 and 1.37 – naturally are the key resistance and support zones. Keep in mind, while the range has held pretty well so far, it wasn’t a precise science. Note how the price traded both above and below the range for brief periods but then returned inside of it. This means that we should focus on the range more loosely, as a wider area where the price may start falling (at resistance) or start climbing (at support).

Japanese Yen Fundamental Outlook: When Will the Ranges Break?
The JPY continues to loosely track US yields as one of its main fundamental (intermarket) drivers. Naturally, that is especially the case for the USDJPY pair, which has been stuck in tight ranges for the past two months, much like the 10-year Treasuries. This means that JPY pairs are also largely correlated with USD pairs at the moment. Hence, much of the action on JPY crosses is affected and can be explained by movements in the dollar.
So, when will the JPY ranges break? The busy weeks ahead with the Fed meeting next Wednesday and Japan set to elect a successor to Prime Minister Suga around the end of the month could provide the catalysts. In the bearish JPY scenario (bullish JPY Fx pairs), US Treasury yields will need to break higher as well to help drive JPY pairs higher too, which likely means the Fed will need to provide a decent hawkish message.
USDJPY Technical Analysis:
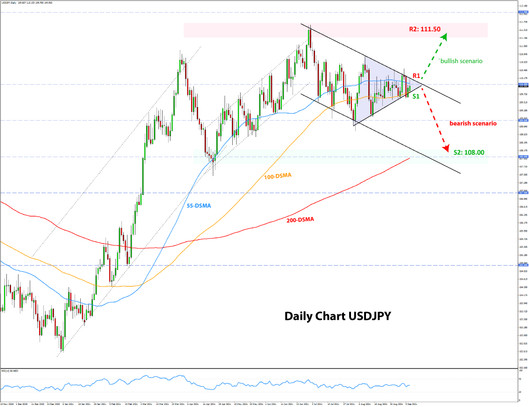
Little has changed on the USDJPY technical picture from 7 days ago. The pair is stuck in a tight compressing range that has the shape of a symmetrical triangle. The support and resistance lines are converging and making the range tighter with time. This week, the support line stands around 109.70 (from 109.60 last week), while the resistance line is around 110.15 (down from around 110.30 last week).
In the slighly larger context, USDJPY has almost precisely to the pip stayed within the downward channel since the July 1 high (see chart below). This sets up the pair for a “nice” and potentially big breakout, either up or down, depending on which way the triangle gets broken.
- A bearish breakout scenario could offer a 150 pips potential to the downside toward the 108.00 support zone.
- Similarly, a bullish breakout scenario could easily take USDJPY about 200 pips higher, closer to the 111.50 resistance near the past highs.


