Bollinger Bands, invented in the 1980s by John Bollinger, have evolved into a prevalent technical analysis indicator. Traders in various markets, such as stocks, futures, and currencies, extensively employ these bands. Bollinger Bands offer a unique perspective into price fluctuations and volatility, serving multiple purposes like identifying overbought and oversold conditions, aiding in trend following, and signaling potential breakouts.
Key Elements of Bollinger Bands
As a trading instrument, Bollinger Bands help traders identify the right moments to enter or exit a trade. They also serve as indicators of overbought and oversold market states. However, using them as a standalone tool can be risky since they primarily focus on price and volatility, ignoring other significant factors. Despite this, both professional and home-based traders favor Bollinger Bands for their simplicity and effectiveness.
Calculating Bollinger Bands
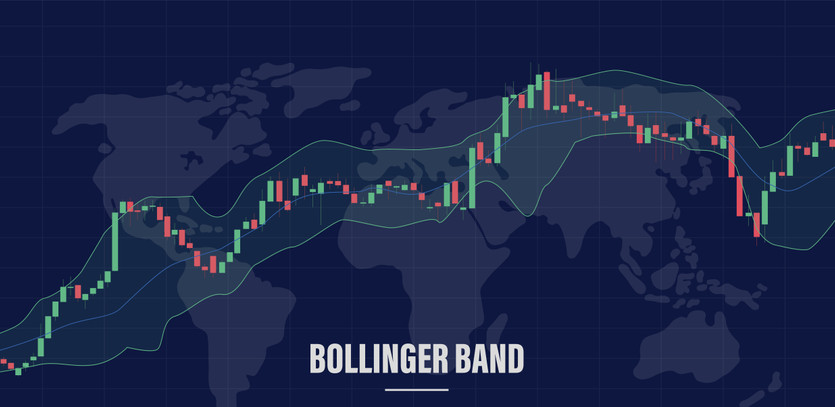
The construction of Bollinger Bands comprises three lines. The standard approach involves using a 20-day simple moving average (SMA) for the middle band. The upper band results from adding twice the daily standard deviation to the middle band, while the lower band is derived by subtracting twice the daily standard deviation from the middle band.
The formula for Bollinger Bands is:
- BOLU=MA(TP,n)+m∗σ[TP,n]
- BOLD=MA(TP,n)−m∗σ[TP,n]
where:
- BOLU=Upper Bollinger Band
- BOLD=Lower Bollinger Band
- MA=Moving average
- TP (typical price)=(High+Low+Close)÷3
- n=Number of days in smoothing period
- m=Number of standard deviations
- σ[TP,n]=Standard Deviation over last n periods of TP
Bollinger Bands and Overbought/Oversold Strategies
Bollinger Bands are often employed to spot overbought or oversold market situations. When the asset's price dips below the Bollinger Bands' lower band, it could signal that prices have dropped excessively and may rebound. Conversely, when the price exceeds the upper band, the market may be overbought and could be due for a correction.
The above strategy hinges on the principle of price mean reversion, which postulates that prices tend to revert to the mean or average after considerable deviations.
In stable markets, mean reversion strategies tend to perform well, as prices oscillate between the two bands like a ping-pong ball. However, Bollinger Bands do not always provide accurate buy and sell signals. For instance, during a potent trend, traders could risk placing trades on the wrong side of the trend, as the indicator might flag overbought or oversold conditions prematurely.
Enhancing Insight with Multiple Bollinger Bands
John Bollinger himself stated, "tags of the bands are just that, tags, not signals." A mere touch of the upper or lower Bollinger Band does not constitute a sell or buy signal, respectively.
At their essence, Bollinger Bands measure deviation, making them valuable tools in trend diagnosis. By generating two sets of Bollinger Bands—one set using "one standard deviation" parameter and another using the typical "two standard deviations" setting—we can observe price from an entirely different perspective. Let's refer to these as Bollinger Band "bands."
For example, when the price remains between the upper Bollinger Bands +1 SD and +2 SD from the mean, the trend is upward; we can identify this channel as the "buy zone." If the price channels within Bollinger Bands -1 SD and -2 SD, it is in the "sell zone." If the price hovers between +1 SD band and -1 SD band, it is essentially in a neutral state or uncharted territory.
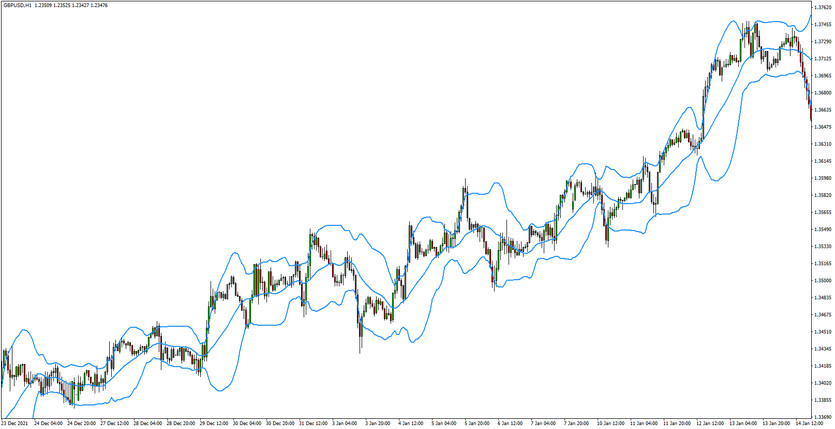
Bollinger Bands dynamically adapt to price expansions and contractions as volatility rises and falls. Consequently, the bands naturally widen and shrink in tandem with price action, thereby creating an exceedingly accurate trending envelope.
Bollinger Bands: A Tool for Trend and Fade Traders
Bollinger Bands have a unique ability to offer insightful perspective for both trend traders and fade traders.
For trend traders, who aim to take advantage of a momentum in a specific direction, Bollinger Bands can be especially useful in indicating when a current trend may continue or reverse. When price breaks the upper or lower Bollinger Band and re-enters, it suggests a continuation of the current trend. Moreover, price often retraces to the middle band (the moving average), providing potential entry points.
Fade traders, on the other hand, attempt to profit from price reversals after periods of either high or low prices (also known as trend exhaustion). They essentially aim to 'fade' the trend. For such traders, Bollinger Bands can signal that a trend is about to reverse. When the price touches or breaks through a Band, only to revert and move in the opposite direction, it's a sign of trend exhaustion. However, fade trading is considered more risky as trends can often make several continuation attempts before reversing. Therefore, having larger error margins is crucial.
Bollinger Bands Squeeze Strategy
The Bollinger Bands Squeeze strategy is another popular method employed by traders worldwide. It's used to identify periods of low volatility that may precede large price movements, offering potential entry points for trades.
A 'squeeze' refers to a situation where the Bollinger Bands move closer together, indicating decreased volatility. This phenomenon generally occurs when the price, after a period of aggressive movement, starts consolidating or moving sideways. These periods of low volatility, or squeezes, are often followed by periods of high volatility as the price breaks out of the squeeze. Traders view the end of the squeeze, marked by the Bands moving apart again, as a signal to enter a trade in the direction of the breakout.
However, caution is needed as the price can break out in either direction, and false breakouts are common. Combining the Bollinger Bands Squeeze strategy with other technical analysis tools can help confirm signals and reduce the risk of false signals.
Bollinger Bands versus Keltner Channels
Bollinger Bands and Keltner Channels are both popular volatility-based technical indicators, yet they utilize different calculations and provide distinct signals.
While Bollinger Bands are based on the standard deviation of the underlying asset's price, demonstrating how much the price deviates from the average price, Keltner Channels use the Average True Range (ATR). ATR is a volatility measure based on the trading range of the security and provides a more direct measure of market volatility.
In general, Bollinger Bands tend to expand and contract more dramatically than Keltner Channels. When the price moves significantly away from the average, Bollinger Bands will expand quicker, reflecting the increased volatility. On the contrary, Keltner Channels react more slowly and stay narrower, creating fewer trading signals.
While both tools are used to identify potential reversals, breakouts, and trend strength, traders often choose the one that best suits their trading style and strategy. Some even use both, looking for periods when the Bollinger Bands move outside the Keltner Channels, which can indicate high volatility and potential trading opportunities.
As with any technical indicator, neither Bollinger Bands nor Keltner Channels should be used in isolation, but rather in combination with other tools and analysis techniques to confirm signals and increase the probability of successful trades.