At the beginning of today's European session, EUR / USD is traded near the 1.2142 mark, which is simultaneously crossed by a short-term resistance level in the form of EMA200 on the 1-hour chart and a support level - EMA200 on the 4-hour chart.
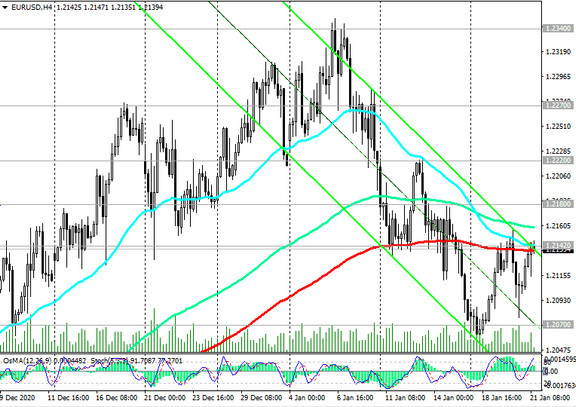
From a technical point of view, this is a key short-term important level. Its breakdown in one direction or another will determine the direction of further dynamics of EUR / USD.
However, one way or another, the long-term positive dynamics of EUR / USD remains on the background of strong fundamental factors. The breakdown of the resistance level 1.2180 (Fibonacci level 50% of the upward correction in the wave of the pair's decline from the level of 1.3870, which began in May 2014) will confirm the tendency of EUR / USD to further growth within the upward channels on the daily and weekly charts. After exceeding the local 32-month maximum near the level 1.2340, the targets will be the resistance levels 1.2500, 1.2580 (the upper border of the channel on the weekly chart and the Fibonacci level of 61.8%), 1.2600.
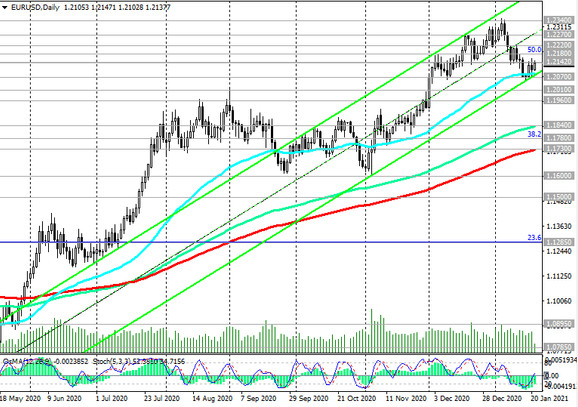
In an alternative scenario and below the local support level 1.2070, short positions will be preferred. If the downward dynamics develops, EUR / USD may decline to long-term support levels 1.1840 (ЕМА144 on the daily chart), 1.1780 (Fibonacci level 38.2%), 1.1730 (ЕМА200 on the daily chart).
A breakdown of the support levels 1.1500 (ЕМА200 on the weekly chart), 1.1285 (Fibonacci level 23.6%) will finally return EUR / USD into a long-term downtrend.
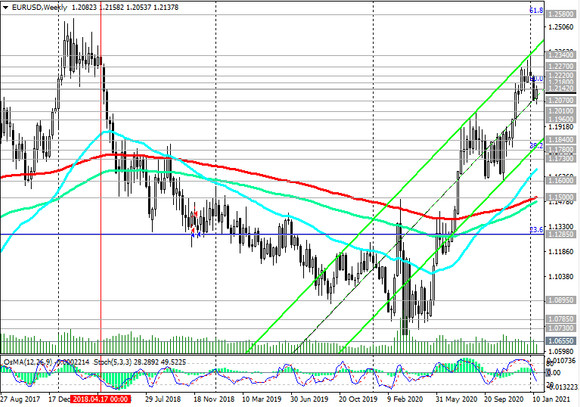
Support levels: 1.2142, 1.2070, 1.2010, 1.1960, 1.1840, 1.1780, 1.1730, 1.1600, 1.1500, 1.1285
Resistance levels: 1.2142, 1.2180, 1.2220, 1.2270, 1.2340, 1.2555, 1.2580, 1.2600
Trading Recommendations
Sell Stop 1.2050. Stop-Loss 1.2170. Take-Profit 1.2010, 1.1960, 1.1840, 1.1780, 1.1730, 1.1600, 1.1500, 1.1285
Buy Stop 1.2170. Stop-Loss 1.2050. Take-Profit 1.2180, 1.2220, 1.2270, 1.2340, 1.2555, 1.2580, 1.2600


