The correlation indicator for MetaTrader 4 is a very valuable trading tool that can be downloaded for free from our website at the following link:
The popular MetaTrader 4 platform, by default, does not include any such indicator or tool that is able to display two different instruments or currency pairs on the same chart. Thus, our indicator comes in handy for conducting this very valuable analysis for Forex trading.
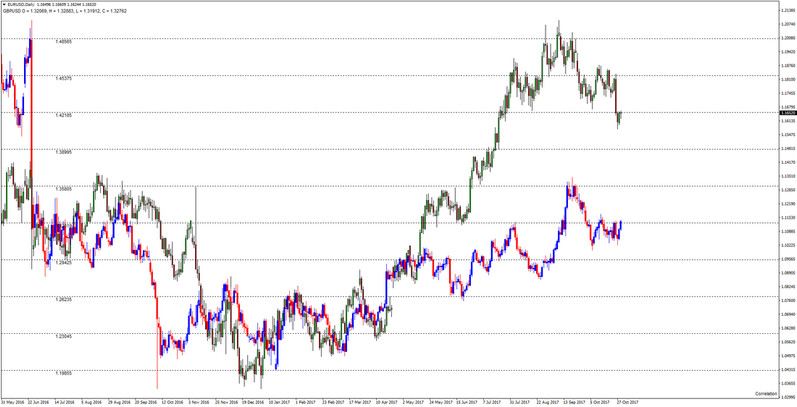
The indicator overlays the original chart with a candlestick price chart of another currency pair (or instrument).
Basically, it’s plotting two different instruments on the same chart and their appropriate price levels. This allows us to examine the correlation between them and trade accordingly.
We know for a fact that some currency pairs, and also some completely different types of financial assets for that matter, are highly correlated. Examining these correlations in real time can give us additional information about a particular currency pair and enable us to pick the market turning points more accurately and also more profitably.
Installing the correlation indicator
After downloading the indicator from the specified link you can install it into your MetaTrader4 Platform normally - as you would install any other MT4 indicator.
For those interested in a detailed guide on how to install indicators in MetaTrader 4, you can read more by visiting the following link:
/forex-blog/how-to-install-ea-indicator-or-script-to-the-mt4-windows-mac
Inputting the correct information
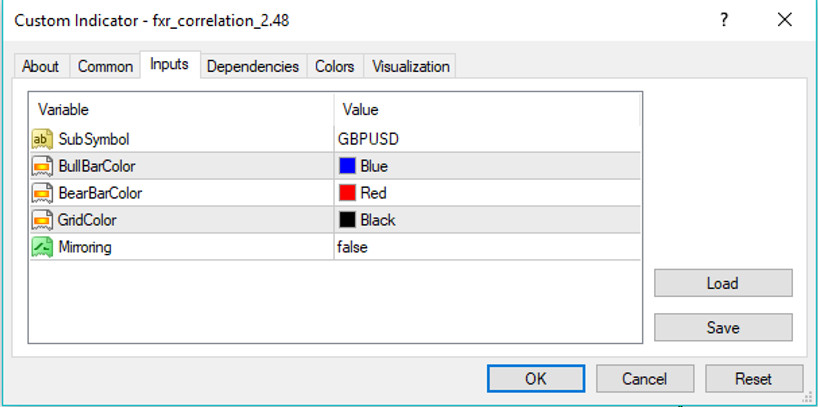
Once you’ve installed the indicator, a pop-up window will appear when you try to plot it on a chart.
The indicator has 5 inputs in total as follows:
- This option is very useful when analyzing inversely correlated Fx pairs and/or instruments. For example, USDCAD and Crude Oil are inversely correlated and by reversing any of the two instruments the correlation will appear positive on the chart. This makes it much easier to analyze the two instruments because it’s much easier for the eye to track how closely the two instruments in question are correlated or not.

The pop-up window of the correlation indicator
After you press ok the indicator will display the second instrument with a candlestick chart on top of the original instrument of the chart. On the left side, the price grid shows the different price levels of the second instrument, while the open, high, low and close of the second instrument are shown in the top left corner.
A few additional words on filling the SubSymbol field
As we said, you must enter the exact same symbol names as they are registered and displayed in your broker’s trading platform.
Different brokers use different symbols for the same instruments and most often, commodities like gold and oil are represented by completely different symbols platform to platform.
Some Forex brokers have additional characters in their labeling of Forex pairs.
For example, the symbol for EURUSD could be “EURUSD.pro”, “EURUSD.ecn” or something similar. If this is the case, then you must enter the exact same symbol into the SubSymbol field or the indicator will not display the additional pair you want to use it for.
Applications of the Correlation Indicator - A picture is worth a thousand words
The indicator is very simple and it’s meant to be used to visually represent the different correlations that exist in the financial markets.
Often times we find different positive and negative numbers between 0 and 100 - used to represent existing correlations between two currency pairs or two assets, however, the number by itself provides no additional information except for the fact that two currencies are correlated or not.
By having the two particular currency pairs plotted on the chart traders can watch how these correlations unfold candle by candle over time. We can visually see how the correlations broke down during some periods in the past and how they recoupled again.
As they say “A picture is worth a thousand words”

The correlation indicator showing a GBPUSD chart over the EURUSD chart (Daily)
Important Forex correlations
The indicator is best to be used on currency pairs that are known to have certain existing and historical correlations with other currency pairs or financial assets.
Thus, some strong cross-asset correlations that are important for any Forex trader to be aware of are:
USDJPY and 10 year US Treasury Yields - Positive correlation
- Negative with the 10 year US Treasury Note (the mirror option of the indicator can be used to flip either USDJPY or the 10Y Note)
USDJPY and Gold – Negative correlation although historically this correlation doesn’t hold super accurately, lately it has been very strong due to the risk aversion status of both gold and the Yen.
USDCHF and Gold – Negative correlation for the same reasons as USDJPY and Gold
AUDUSD and Copper - Positive correlation
AUDUSD and Gold – Positive correlation
USDCAD and WTI Crude Oil – Negative Correlation
Some important correlations that exist between different currency pairs include:
EURUSD and GBPUSD – Positively correlated
AUDUSD and NZDUSD – Positively correlated
AUDUSD and USDCAD – Negatively correlated
NZDUSD and USDCAD – Negatively correlated
USDJPY and USDCHF - Positively correlated
Finally, it’s important to know how to use the different correlations and what certain patterns mean when they occur. You can read more about this in the following two posts on our website:
Correlation Between Commodities and Forex
Like any other indicator, with time and practice trading with the correlation indicator will become more natural, intuitive and accurate. Although at first, they may seem complex and even not very helpful maybe, correlations in financial markets and the information they provide to traders is invaluable and is something that should not be ignored.


