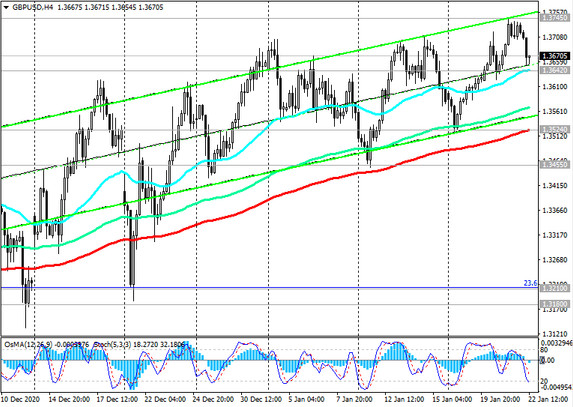
As of this writing, GBP / USD is traded near 1.3670 mark, 75 pips below the local 2.5-year high of 1.3745 reached last Thursday.
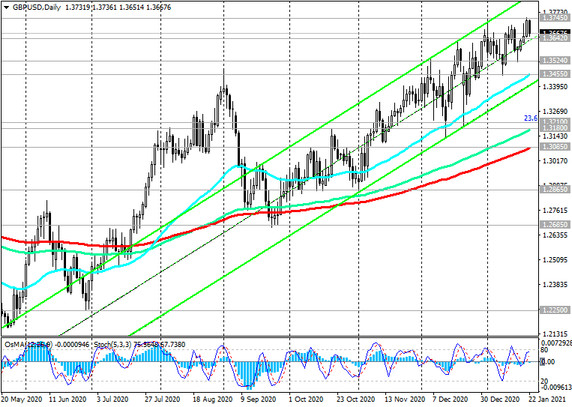
GBP / USD is traded in upward channels on the daily and weekly charts, generally maintaining long-term positive dynamics.
Remaining in the zone above the key support levels 1.3085 (ЕМА200 on the daily chart), 1.3180 (ЕМА200 on the weekly chart), the pair is in the bull market zone.

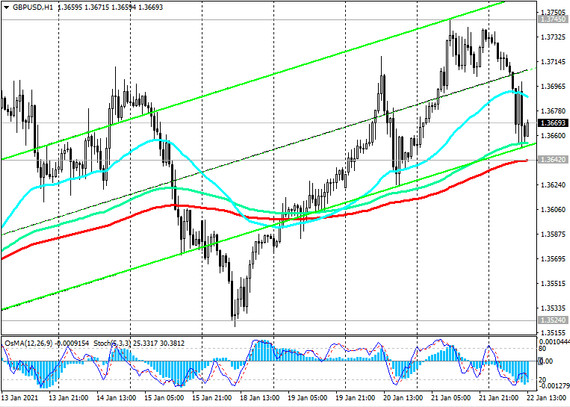
Moreover, in the area of current marks and support level 1.3642 (ЕМА200 on the 1-hour chart), opening of new long positions looks attractive.

If this support level is broken and the stops are triggered (near the 1.3630 mark), the next successful zone for placing pending buy orders will be the support level 1.3524 (ЕМА200 on the 4-hour chart).

Only a breakdown of the support level 1.3455 (ЕМА50 and the lower line of the ascending channel on the daily chart) can provoke a deeper decline in GBP / USD, up to support levels 1.3210 (Fibonacci 23.6% retracement to the decline of the GBP / USD pair in the wave that began in July 2014 near the level of 1.7200), 1.3180 (ЕМА144 on the daily and ЕМА200 on the weekly charts).
After the breakdown of the support level 1.3085, one should expect a decline towards the support level 1.2865. A breakdown of the local support level 1.2685 (September lows) will increase the risks of a resumption of the global bearish trend in GBP / USD and may provoke a deeper decline towards support levels 1.2250, 1.2085, 1.2000 (Fibonacci level 0%).
Support levels: 1.3642, 1.3524, 1.3455, 1.3400, 1.3300, 1.3210, 1.3180, 1.3085, 1.2865
Resistance levels: 1.3700, 1.3745, 1.3800, 1.3900, 1.3960
Trading recommendations
Sell Stop 1.3630. Stop-Loss 1.3710. Take-Profit 1.3600, 1.3524, 1.3455, 1.3400, 1.3300, 1.3210, 1.3180, 1.3085, 1.2865
Buy by market. Buy Stop 1.3710. Stop-Loss 1.3630. Take-Profit 1.3700, 1.3745, 1.3800, 1.3900, 1.3960


