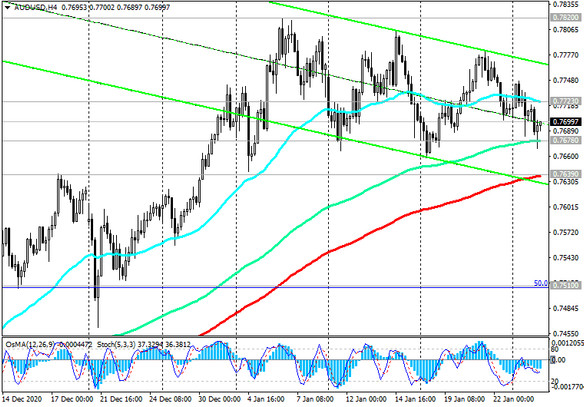
As we noted earlier, at the beginning of today's European session, the AUD / USD pair is traded in the zone of important short-term levels of support 0.7639 (EMA200 on the 4-hour chart) and resistance 0.7723 (EMA200 on the 1-hour chart).
A breakdown of these levels in one direction or another and an exit from this range can predetermine the direction of further dynamics of AUD / USD.
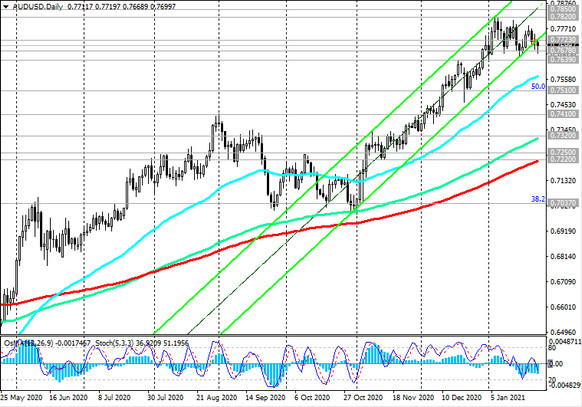
At the same time, above the key support levels 0.7220 (ЕМА200 on the daily chart), 0.7250 (ЕМА200 on the weekly chart), the long-term positive dynamics of AUD / USD remains.
In the current situation, long positions remain preferable, and therefore a breakdown of the resistance level of 0.7723 will be a signal to build up long positions in AUD / USD, and a decline to the support level of 0.7639 will create additional buying opportunities.
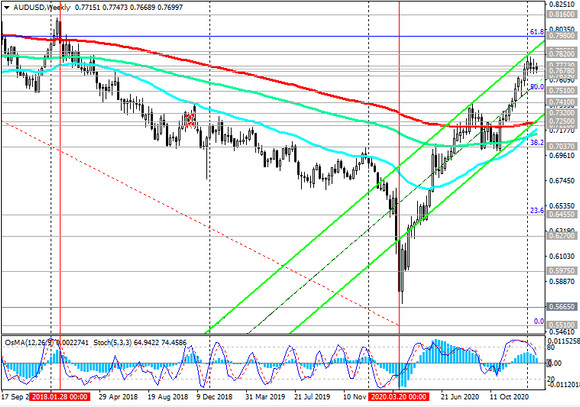
A breakout of the local resistance level of 0.7820 (highs of the year and 30-month highs) will be a signal for renewed growth of AUD / USD towards the resistance levels of 0.7850 (ЕМА200 on the monthly chart), 0.7980 (Fibonacci level 61.8% of the correction to the wave of the pair's decline from the level of 0.9500 in July 2014 to the lows of 2020 near the 0.5510 mark), 0.8160.
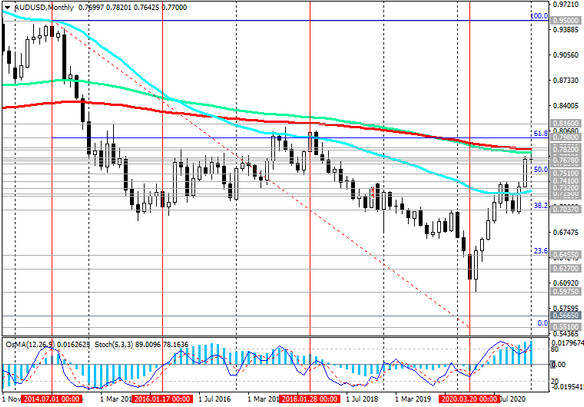
In the alternative scenario and after the breakdown of the support level 0.7580 (ЕМА50 on the daily chart), the likelihood of a further decline in AUD / USD will increase towards the support levels 0.7320 (ЕМА144 on the daily chart), 0.7250, 0.7220.
Support Levels: 0.7678, 0.7639, 0.7580, 0.7510, 0.7410, 0.7320, 0.7250, 0.7220, 0.7130, 0.7037
Resistance Levels: 0.7723, 0.7820, 0.7850, 0.7980, 0.8160
Trading Recommendations
Sell Stop 0.7625. Stop-Loss 0.7730. Take-Profit 0.7580, 0.7510, 0.7410, 0.7320, 0.7250, 0.7220, 0.7130, 0.7037
Buy Stop 0.7730. Stop-Loss 0.7625. Take-Profit 0.7820, 0.7850, 0.7980, 0.8160


