The trading strategy for Donchian's price channels refers to the so-called channel strategies. All channel strategies are based on one or more indicators that form the channel within which the price moves. Since this strategy refers to channel strategies, it also involves the use of an indicator.
You can download and install the Donchian Channel MT4 indicator here: go to this page.
Donchian price channel
The Donchian price channel visualizes two lines on the chart - the upper and lower border of the channel.
The upper line of the Donchian channel, located on the price chart, is at the maximum level for the last N time periods (m1, m5, m30, h1, h4, etc.). The lower line, respectively, is at the minimum level for the last N time periods. N is the number of time periods that the user sets in the indicator settings. By default, this value is 20, because the author and creator of the channel, Richard Donchian, recommended that this value be used. The user can change this value at his discretion.
You can learn more about the properties and values of the indicator at the download page for the Donchian channel indicator.
Trading strategy with the channels of Donchian
First of all, it is necessary to analyze the charts of actives available for trading and find among them the one that shows a long steady upward or downward trend. It is desirable that the trend be clearly visible on several timeframes at the same time - on the hourly H1, and on H4, and on the daily D1.
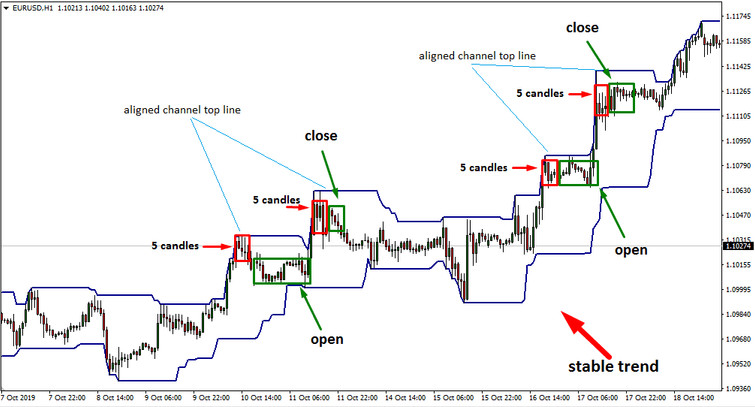
Apply the indicator "Donchian_channel" to the selected chart. If at this moment the channel lines are not horizontal (that is, a driving impulse is already forming on the market), you must wait until they are aligned and become horizontal. It is recommended to wait for the stable horizontal alignment of one of the channel lines for 5 candles, depending on the timeframe you choose.
After the borders of the indicator are aligned, you can open a deal in the direction in which the previous impulse was formed. For example, if an upward movement was observed in the plot of the chart that precedes the alignment of the Donchian Channel lines, then at the moment when the channel borders become horizontal, you can open a buy deal.

If the expectations were met, and the market really began to move in the predicted direction, then immediately after the Donchian channel began to expand, the stop loss for the deal must be transferred to the end point of the previous correction. If possible, stop loss should be set to breakeven.
Profit should be taken on the deal when, after a moving impulse, the upper (if the trend is upward) or lower (if the trend is downward) line becomes horizontal.
Conclusion
This trading strategy, as you might guess, is a trending strategy. It should be used on actives with a clearly traceable trend movement, adhering to strict rules of risk control and money management.


