For the last 8 weeks, the NZD / USD pair has been trading in a range between the resistance level 0.7240 (Fibonacci 38.2% retracement in the global wave of the pair's decline from the level of 0.8820) and the support level 0.7100.
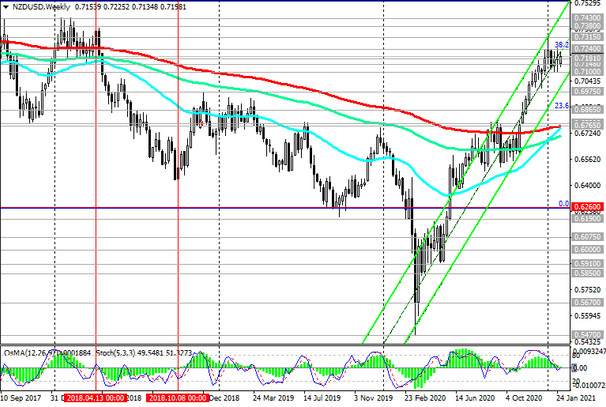
At the same time, the pair maintains long-term positive dynamics, remaining traded above the key support levels 0.6975 (ЕМА200 on the monthly chart), 0.6780 (ЕМА200 on the daily and weekly charts) in the ascending channels on the daily and weekly charts.
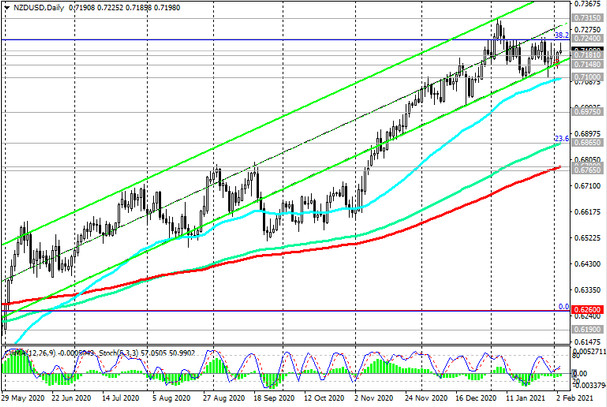
Above the important support levels 0.7148 (ЕМА200 on the 4-hour chart), 0.7100 nothing threatens long positions in NZD / USD.
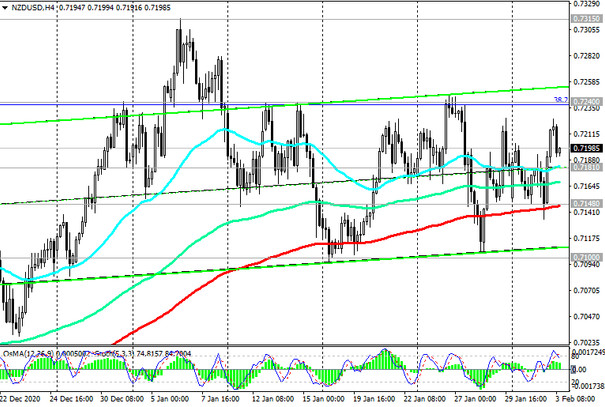
Probably, in case of a confirmed breakdown of the resistance level 0.7240, the growth of NZD / USD will continue towards the resistance levels 0.7315 (local maximum), 0.7380, 0.7430 (the upper border of the ascending channel on the weekly chart).
In an alternative scenario, NZD / USD will resume its decline to support levels 0.6865 (Fibonacci 23.6% and ЕМА144 on the daily chart), 0.6780. A signal for the implementation of this scenario will be a breakdown of the support level 0.7100, and a breakdown of the support level 0.6780 will significantly increase the likelihood of a further decline of the NZD / USD and its return to the global downtrend that began in July 2014.
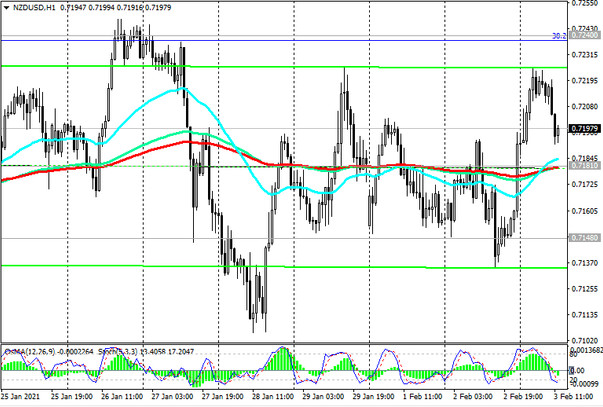
Support levels: 0.7181, 0.7148, 0.7100, 0.6975, 0.6865, 0.6780
Resistance levels: 0.7240, 0.7315, 0.7380, 0.7430
Trading recommendations
Sell Stop 0.7170. Stop-Loss 0.7230. Take-Profit 0.7100, 0.6975, 0.6865, 0.6780
Buy Stop 0.7230. Stop-Loss 0.7170. Take-Profit 0.7240, 0.7315, 0.7380, 0.7430