Last week, XAU / USD broke through the key long-term support level 1821.00 (ЕМА200 on the daily chart), and today XAU / USD is also traded below this level, trying to develop the downtrend.
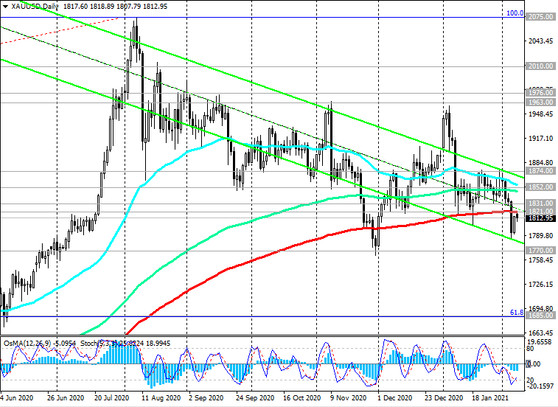
A breakdown of the local support level 1770.00 (November 2020 lows) will confirm the renewed downtrend towards support levels 1600.00 (ЕМА144 on the weekly chart), 1560.00 (Fibonacci level 50% of the correction to the growth wave since November 2015 and 1050.00), 1535.00 (ЕМА200 at weekly chart).
In an alternative scenario, the breakdown of resistance levels 1852.00 (ЕМА200 on the 4-hour chart), 1874.00 (local resistance level) will confirm the recovery of the positive dynamics of XAU / USD and direct it towards local highs and the upper border of the descending channel on the weekly chart (marks 1963.00, 1976.00).
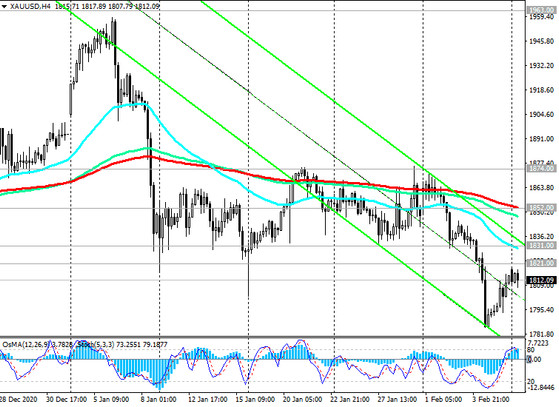
Their breakdown, in turn, will create preconditions for the return of XAU / USD into the zone of record highs reached in early August 2020 near the level of 2075.00.
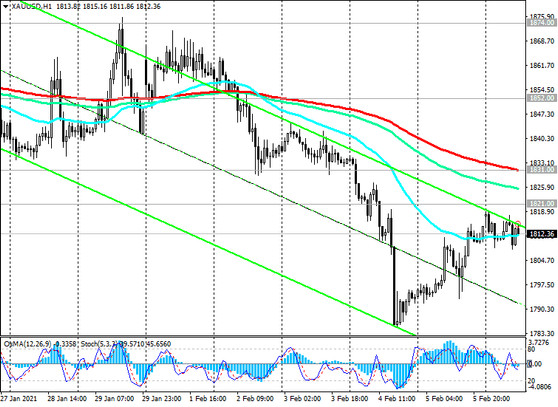
Support levels: 1800.00, 1770.00, 1685.00, 1600.00, 1560.00, 1535.00
Resistance levels: 1821.00, 1831.00, 1852.00, 1874.00, 1963.00, 1976.00, 2010.00, 2075.00
Trading recommendations
Sell Stop 1804.00. Stop-Loss 1823.00. Take-Profit 1800.00, 1770.00, 1685.00, 1600.00, 1560.00, 1535.00
Buy Stop 1823.00. Stop-Loss 1804.00. Take-Profit 1831.00, 1852.00, 1874.00, 1963.00, 1976.00, 2010.00, 2075.00


