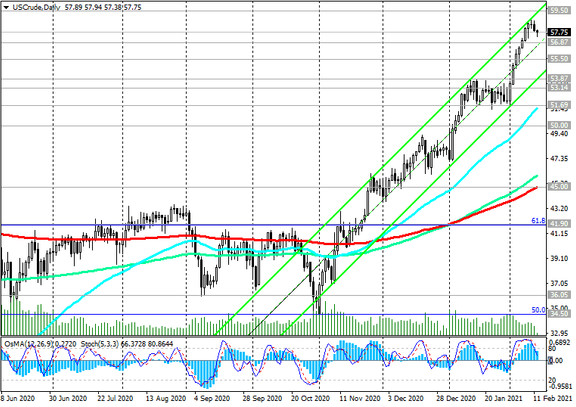
Despite today's decline, WTI crude is traded in the bull market zone, above the key support levels 55.50 (ЕМА200 on the monthly chart), 50.00 (ЕМА200 on the weekly chart), 45.00 (ЕМА200 on the daily chart).
The price also remains above the important short-term support levels 56.87 (ЕМА200 on the 1-hour chart), 53.14 (ЕМА200 on the 4-hour chart). Above the support level 56.87, nothing threatens long positions, and in case of resumption of positive dynamics, and after the breakdown of the local resistance level 58.88 (13-month highs), the growth of the WTI oil price will continue towards the local resistance level 63.50 and possibly above the 65.65 mark, near which a collapse fall in prices began in early January 2020.
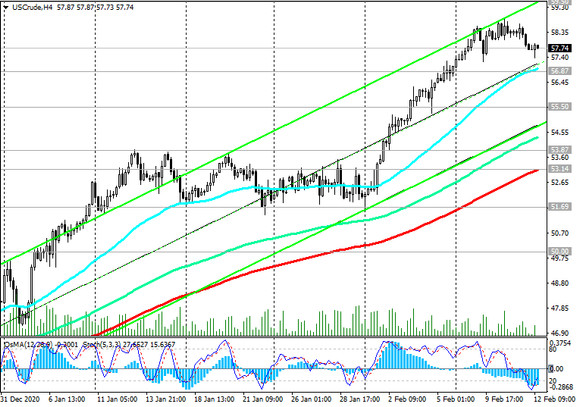
In an alternative scenario, after the breakdown of the support levels 53.14, 45.00, the price risks switching back to a downtrend. A breakdown of the 41.90 support level (61.8% Fibonacci level of the upward correction to the fall from this year's highs near 65.65 to a local low of 3.42) will increase the risks of a renewed bearish trend in WTI crude oil.
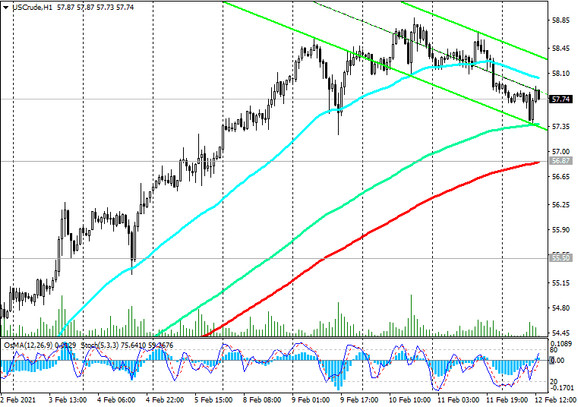
The first signal for the implementation of this scenario will be the breakout of the important short-term support level 56.87 (ЕМА200 on the 1-hour chart).
Support levels: 56.87, 55.50, 53.87, 53.14, 51.69, 50.00, 45.00, 41.90
Resistance levels: 59.50, 63.50, 65.65
Trading recommendations
Sell Stop 56.80. Stop-Loss 58.30. Take-Profit 55.50, 53.87, 53.14, 51.69, 50.00, 45.00
Buy by market, Buy Stop 58.30. Stop-Loss 40.80. Take-Profit 59.00, 59.50, 63.50, 65.65