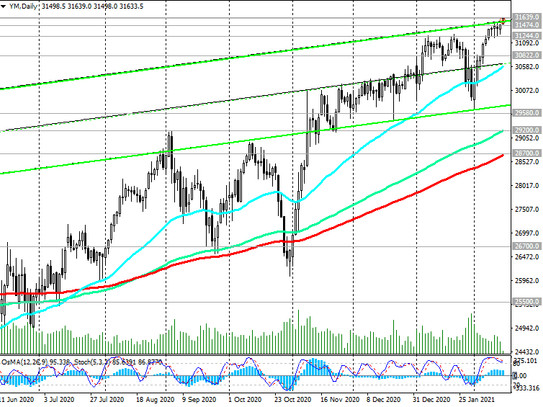
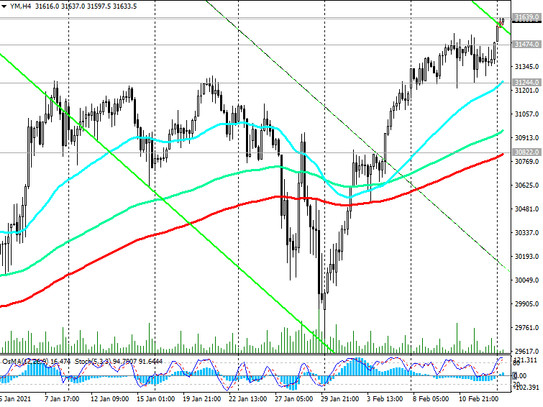
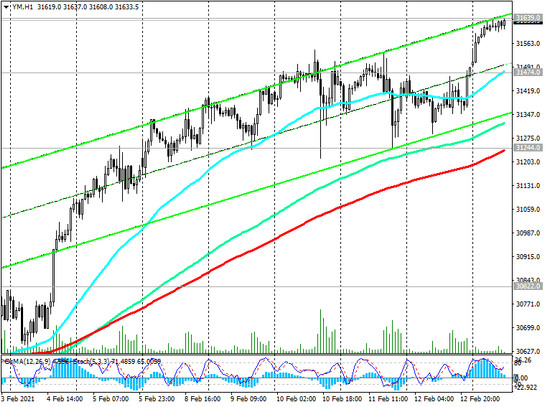
As we noted above, the Dow Jones Industrial Average gained +1% over the entire last week. At the start of today's European session, DJIA futures rose to a new all-time high of 31639.0, maintaining positive momentum.
In March, the DJIA reached a local multi-year bottom near 18210.0 mark amid panic due to the coronavirus pandemic, and then the index began a gradual recovery, supported by the Fed's super-soft monetary policy.
The DJIA is currently traded near 31639.0 mark, continuing to trade in the zone above the key support levels 29580.0 (highs of the previous DJIA growth wave that began in February 2016 at 15500.0), 28700.0 (ЕМА200 on the daily chart), 25500.0 (ЕМА200 on the weekly chart) , also staying within the ascending channel on the weekly chart.

The rapid growth of optimism, fueled by the efforts of the Fed and other major world central banks, which cut rates to near-zero levels, resulted in the growth of US and world stock indices.
From a fundamental and technical point of view, it is logical to assume further growth of the DJIA.

In an alternative scenario, a signal for selling will be a confirmed breakout of the support levels 31244.0 (ЕМА200 on the 1-hour chart), 30822.0 (ЕМА200 on the 4-hour chart).

The fundamental driver for the decline may be the return of pessimistic sentiments associated with an increase in the number of cases of coronavirus and a new round of economic slowdown.
In the meantime, the market seems to be aimed at further growth.
Support levels: 31474.0, 31244.0, 30822.0, 29580.0, 29200.0, 28700.0, 26700.0, 25500.0
Resistance levels: 31639.0, 32000.0, 33000.0
Trading recommendations
Buy by market, Buy Limit 31470.0, 31260.0. Stop-Loss 31220.0. Take-Profit 32000.0, 33000.0, 34000.0
Sell Stop 31220.0. Stop-Loss 31640.0. Take-Profit 31244.0, 31000.0, 30822.0


