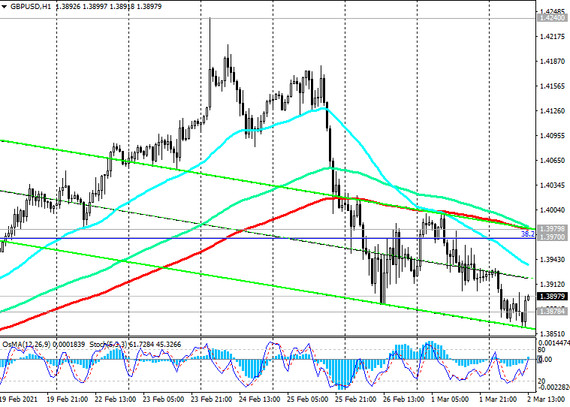
At the time of publication of this article, the GBP / USD pair is traded in the zone of strong short-term support levels 1.3878 (EMA144 on the 4-hour chart), 1.3823 (EMA200 on the 4-hour chart). Considering the long-term upward dynamics of the pair, it is logical to place buy orders in this zone with stops below the support level 1.3823.
GBP / USD continues to trade within the upward channels on the daily and weekly charts, generally maintaining long-term positive dynamics.
After the breakdown of resistance levels 1.3970 (Fibonacci level 38.2% of the correction to the decline of the GBP / USD pair in the wave that began in July 2014 near the level of 1.7200), 1.3979 (ЕМА200 on the 1-hour chart) GBP / USD growth will continue towards resistance levels 1.4240, 1.4350, 1.4440, 1.4830 (50% Fibonacci level), 1.4830 (ЕМА200 on the monthly chart).
In an alternative scenario and after the breakdown of the support levels 1.3823, 1.3730 (ЕМА50 on the daily chart) GBP / USD may decline to support levels 1.3390 (ЕМА144 on the daily chart), 1.3270 (ЕМА200 on the daily chart), 1.3210 (ЕМА200 on the weekly chart).
However, only a breakdown of the local support level 1.2685 (September 2020 lows) will increase the risks of a resumption of the global bearish trend in GBP / USD and may provoke a deeper decline towards the support levels 1.2250, 1.2085, 1.2000 (Fibonacci level 0%).
Support levels: 1.3878, 1.3823, 1.3730, 1.3565, 1.3390, 1.3270, 1.3210
Resistance levels: 1.3970, 1.3979, 1.4100, 1.4350, 1.4440, 1.4580
Trading recommendations
Sell Stop 1.3850. Stop-Loss 1.3940. Take-Profit 1.3823, 1.3730, 1.3565, 1.3390, 1.3270, 1.3210
Buy by-market, Buy Stop 1.3940. Stop-Loss 1.3850. Take-Profit 1.3970, 1.3979, 1.4100, 1.4350, 1.4440, 1.4580


