At the beginning of today's European session, the XAU / USD pair is traded near 1693.00 mark, just above the important support level 1685.00 (61.8% Fibonacci level of the correction to the wave of growth since November 2015 and the level of 1050.00). Its breakdown will strengthen the downtrend and send XAU / USD towards support levels 1605.00 (ЕМА144 on the weekly chart and the lower border of the descending channel on the daily chart), 1560.00 (Fibonacci level 50%), 1540.00 (ЕМА200 on the weekly chart).
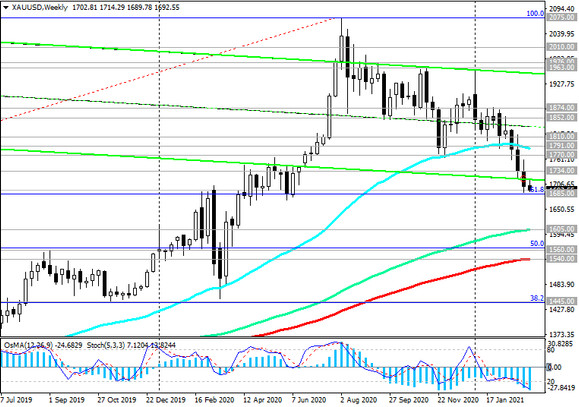
And in case of their breakdown, XAU / USD will go towards the key support levels 1295.00 (Fibonacci level 23.6% and ЕМА144 on the monthly chart), 1185.00 (ЕМА200 on the monthly chart) separating the long-term bullish trend from the bearish one.
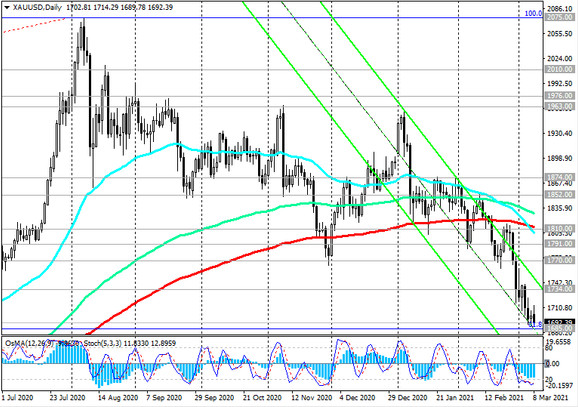
In an alternative scenario, the breakdown of the resistance levels 1791.00 (ЕМА200 on the 4-hour chart), 1810.00 (ЕМА200 on the daily chart) will confirm the recovery of the positive dynamics of XAU / USD and direct it towards local highs (marks 1963.00, 1976.00).
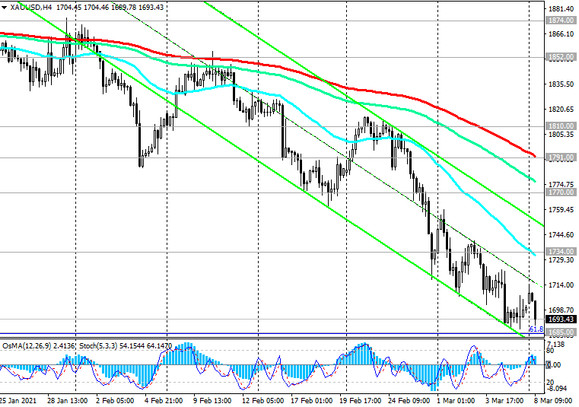
Their breakdown, in turn, will create preconditions for the return of XAU / USD into the zone of record highs reached in early August 2020 near the level 2075.00. The first signal for the implementation of this scenario will be a breakdown of the important short-term resistance level 1734.00 (ЕМА200 on the 1-hour chart).
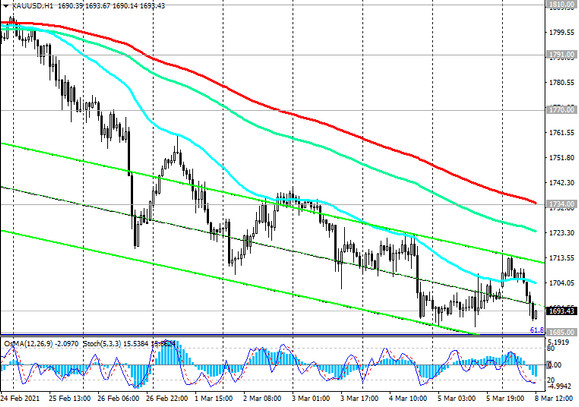
Support levels: 1685.00, 1605.00, 1560.00, 1540.00
Resistance levels: 1734.00, 1770.00, 1791.00, 1810.00, 1852.00, 1874.00, 1963.00, 1976.00, 2010.00, 2075.00
Trading recommendations
Sell Stop 1683.00. Stop-Loss 1720.00. Take-Profit 1600.00, 1560.00, 1545.00
Buy Stop 1742.00. Stop-Loss 1683.00. Take-Profit 1770.00, 1791.00, 1810.00, 1852.00, 1874.00, 1963.00, 1976.00, 2010.00, 2075.00


