At the beginning of today's European session, the pair is traded near the level of 0.9360, maintaining the trend towards further growth.

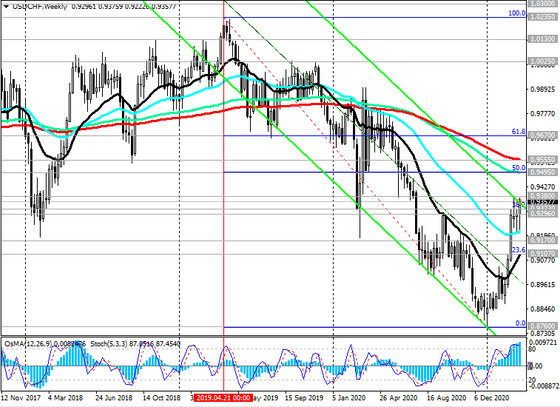
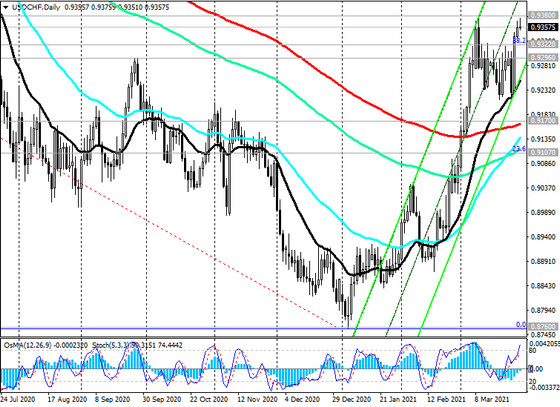
Having reached a local 8-month high near 0.9375 at the beginning of this month, USD / CHF is developing positive dynamics, traded in an upward channel on the daily chart, the upper border of which is near the resistance level 0.9670 (Fibonacci level 61.8% of the correction to the decline wave that began in April 2019 near 1.0235).

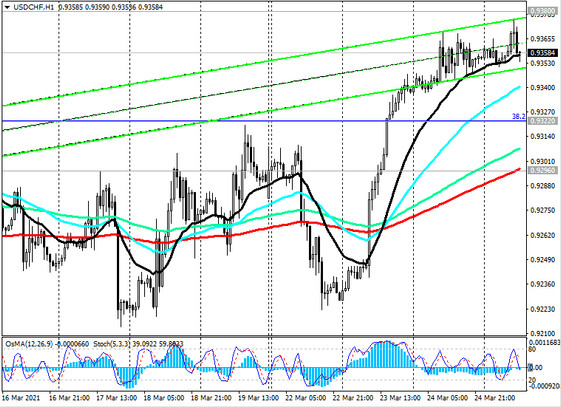
In the current situation of strengthening the dollar, long positions in USD / CHF are preferable, and the breakdown of the local resistance level 0.9380 will be a signal for their buildup. Also, one cannot exclude the currency intervention of the NBS with the sale of the franc, which the bank never announces either before or after this intervention.
If the USD / CHF continues to rise, the closest target will be the resistance level 0.9495 (ЕМА144 on the weekly chart and 50% Fibonacci level). More distant growth targets are located at resistance levels 0.9555 (ЕМА200 on the weekly chart), 0.9670.

In an alternative scenario, a signal for selling will be a breakdown of the support levels 0.9322 (Fibonacci level 38.2), 0.9296 (ЕМА200 on the 1-hour chart), and the target of decline will be the support level 0.9170 (ЕМА200 on the daily chart).
Support levels: 0.9322, 0.9296, 0.9200, 0.9170, 0.9107, 0.9000
Resistance levels: 0.9380, 0.9495, 0.9555, 0.9670
Trading scenarios
Sell Stop 0.9320. Stop-Loss 0.9385. Take-Profit 0.9296, 0.9200, 0.9170, 0.9107, 0.9000
Buy Stop 0.9385. Stop-Loss 0.9320. Take-Profit 0.9495, 0.9555, 0.9670


