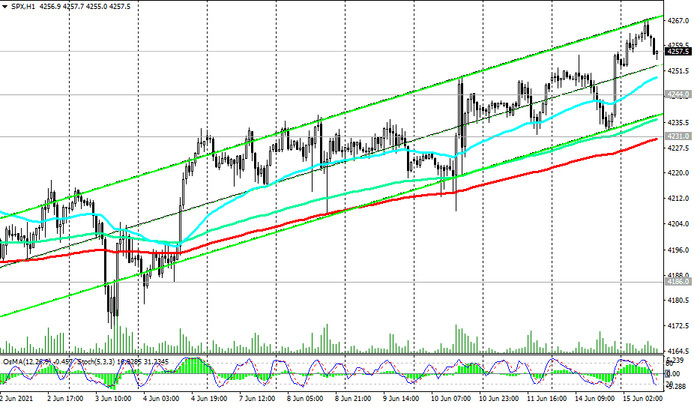
During today's Asian session, the S&P 500 futures price reached a new all-time high near 4267.0 mark.
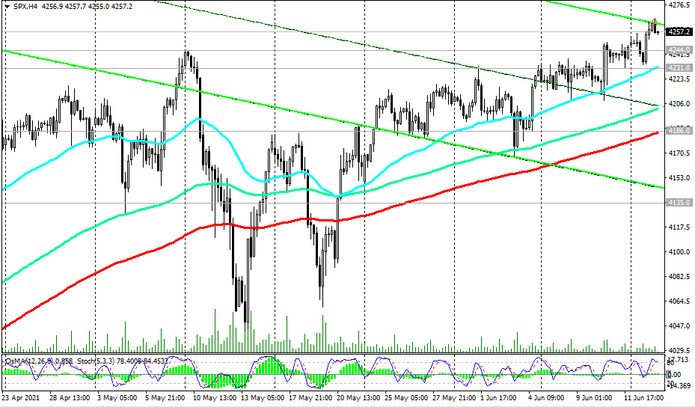
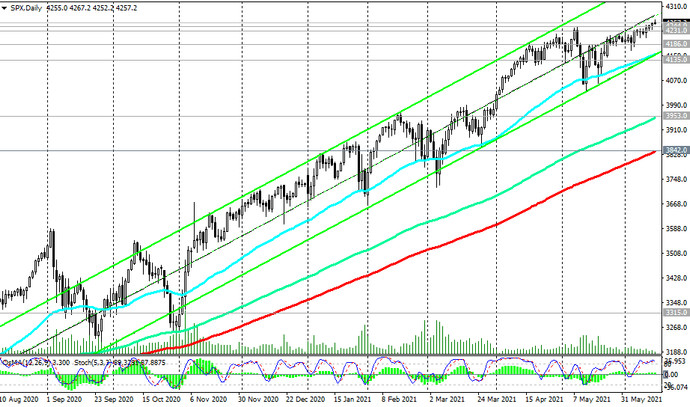
The S&P 500 remains in the long-term bull market. Above the important short-term support levels 4231.0 (ЕМА200 on the 1-hour chart), 4186.0 (ЕМА200 on the 4-hour chart), 4155.0 (ЕМА50 and the lower line of the ascending channel on the daily chart), nothing threatens long positions in the S&P 500.
A breakdown of the local resistance level 4267.0 will be a signal for the resumption of the bullish trend of the S&P 500 and its further growth.
In an alternative scenario, the breakdown of support level 4155 will be a signal for a possibly deeper corrective decline to support levels 3953.0 (ЕМА144 on the daily chart), 3842.0 (ЕМА200 on the daily chart). The first signal for this may be a breakdown of the support level 4231.0.
Support levels: 4244.0, 4231.0, 4200.0, 4186.0, 4155.0, 4000.0, 3953.0, 3842.0
Resistance levels: 4267.0, 4300.0, 4325.0, 4400.0
Trading recommendations
Sell Stop 4229.0. Stop-Loss 4268.0. Targets 4200.0, 4186.0, 4155.0, 4000.0, 3953.0, 3842.0
Buy Stop 4268.0. Stop-Loss 4229.0. Targets 4300.0, 4325.0, 4400.0