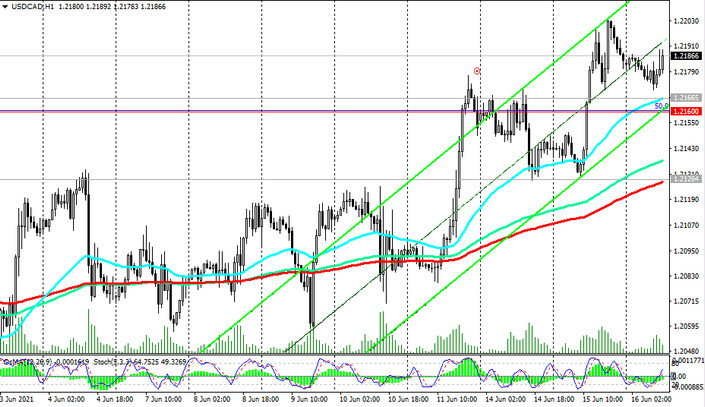
As we noted above, since the opening of today's trading day and at the time of publication of this article, the USD / CAD pair has been trading in a narrow range near the 1.2185 mark, about 20 pips below the June and 6-week highs of 1.2204.
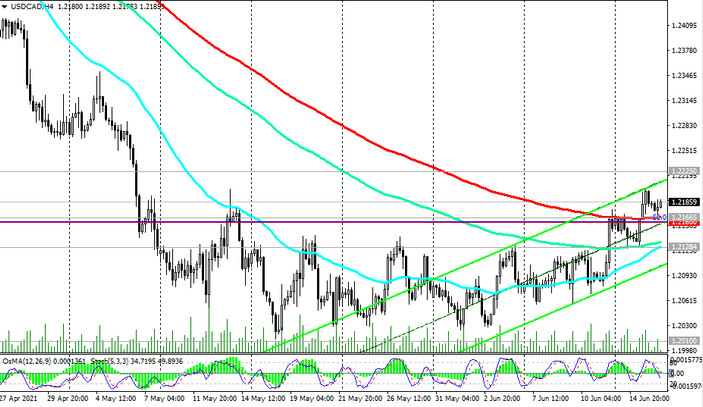
At the same time, the price broke through the important short-term resistance levels 1.2128 (ЕМА200 on the 1-hour USD / CAD chart), 1.2166 (ЕМА200 on the 4-hour USD / CAD chart) and continues to grow towards the important medium-term resistance level 1.2225 (ЕМА50 on the daily chart).
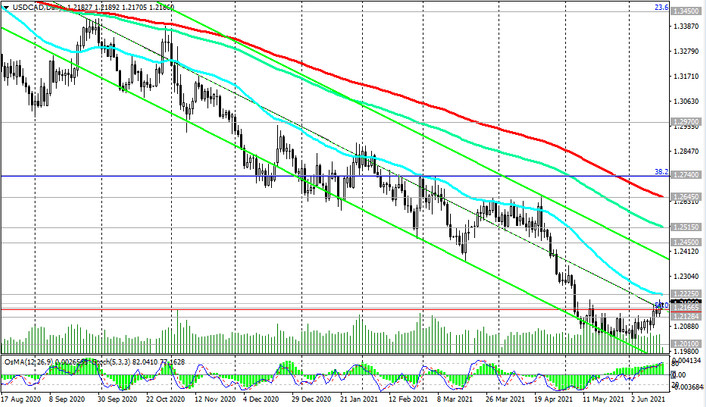
If the Fed leaders do not start to disturb market participants with unexpected statements following the Fed meeting, which ends at 18:00 (GMT), then the growth of USD / CAD above the resistance level 1.2225 should not be expected. In this case, USD / CAD is likely to resume its downward trend, and the breakdown of support levels 1.2166, 1.2160 (Fibonacci level 50% of the downward correction in the wave of USD / CAD growth from 0.9700 to 1.4600) will be a signal for the resumption of short positions.
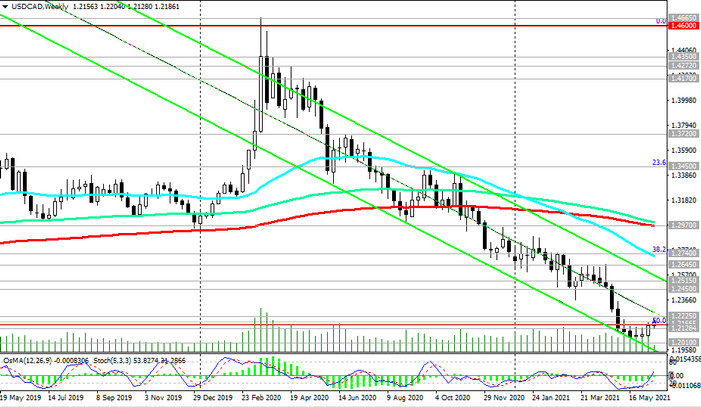
Staying below the key resistance levels 1.2450 (ЕМА200 on the monthly chart), 1.2970 (ЕМА200 on the weekly chart), 1.2645 (ЕМА200 on the daily chart), in fact, USD / CAD is in the bear market zone.
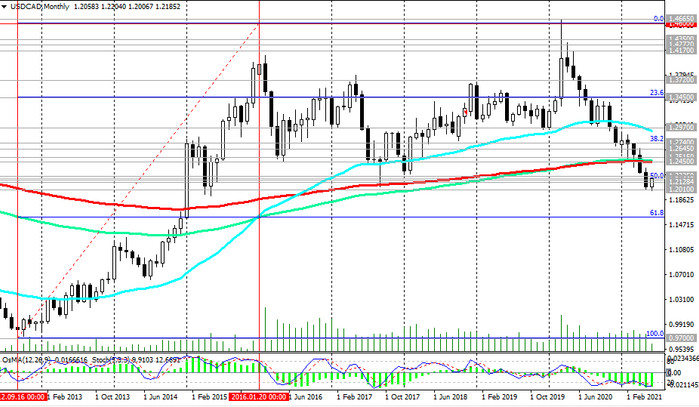
In an alternative scenario, the breakdown of the resistance level 1.2225 will become a confirmation signal of the beginning of a reversal and breaking of the bearish trend in USD / CAD with the prospect of growth to resistance levels 1.2450, 1.2645, 1.2740 (Fibonacci level 38.2%).
Support levels: 1.2165, 1.2160, 1.2128, 1.2085, 1.2010
Resistance levels: 1.2225, 1.2450, 1.2515, 1.2645, 1.2740, 1.2970
Trading scenarios
Sell Stop 1.2155. Stop-Loss 1.2215. Take-Profit 1.2128, 1.2085, 1.2010
Buy Stop 1.2215. Stop-Loss 1.2155. Take-Profit 1.2225, 1.2450, 1.2515, 1.2645, 1.2740, 1.2970

