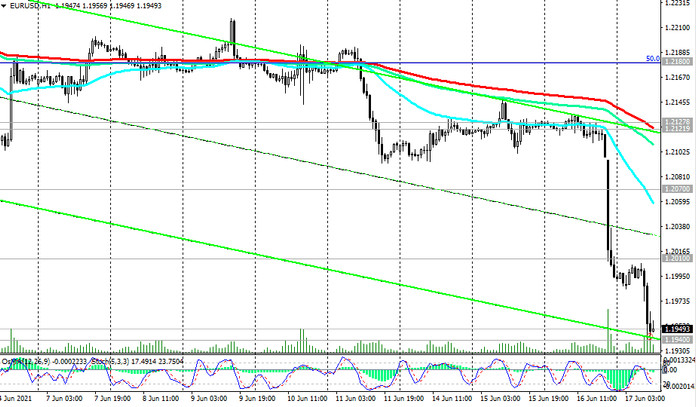
On Wednesday, the EUR / USD pair fell sharply against the background of the strengthening of the dollar, which, in turn, received support from the statements of the Fed leaders, made by them following the meeting that ended at 18:00 (GMT).
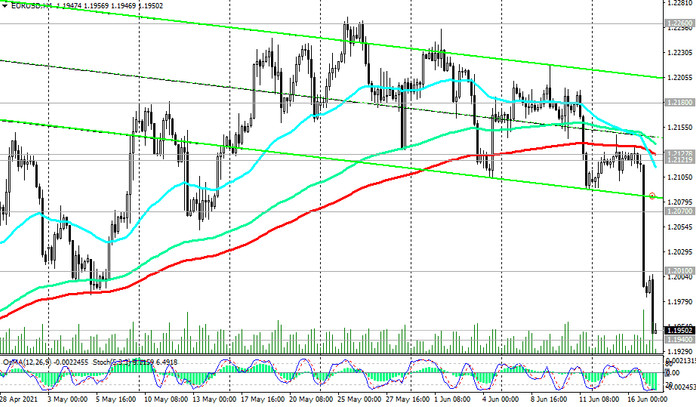
Until yesterday, EUR / USD has already broken through two important support levels 1.2128 (ЕМА200 on the 4-hour chart) and 1.2122 (ЕМА200 on the 1-hour chart), keeping the readiness for further decline in anticipation of new drivers.
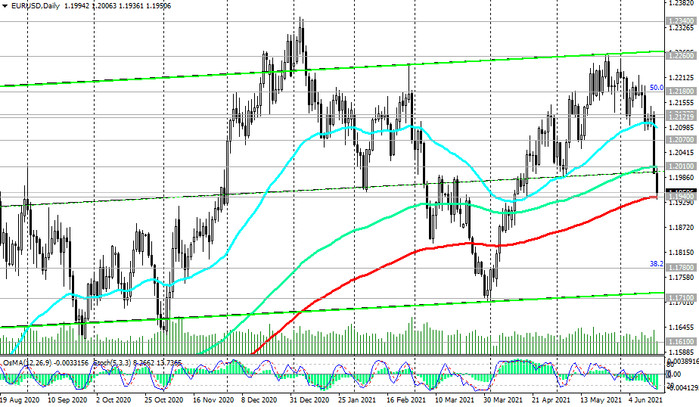
And such drivers appeared on Wednesday. At the end of yesterday's trading day, the price broke through the important support level 1.2010 (ЕМА144 on the daily chart) and today the EUR / USD continues to decline.
At the time of publication of this article, the EUR / USD pair is traded near the key long-term support level 1.1940 (ЕМА200 on the daily chart). Its breakdown and breakdown of the support level 1.1880 (ЕМА50 on the weekly chart) increases the risks of breaking the EUR / USD bullish trend.
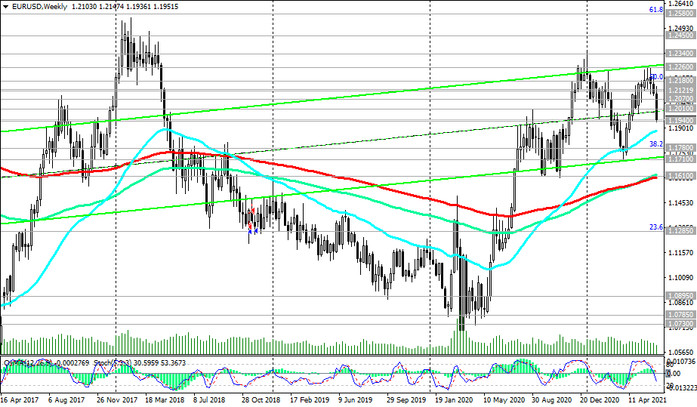
In case of further decline, EUR / USD may head towards the key long-term support level 1.1610 (ЕМА144 and ЕМА200 on the weekly chart). Its breakdown will finally break the EUR / USD bullish trend.
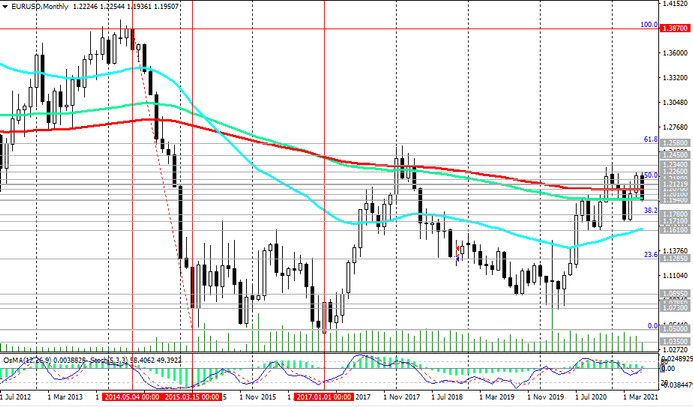
In an alternative scenario, the decline in EUR / USD will stop near the current marks and the support level 1.1940, and the rise into the zone above the resistance level 1.2010 will start a new wave of growth in EUR / USD with targets located near the recent highs of 1.2180 (Fibonacci level 50% of the upward correction in the wave of the pair's decline from the level of 1.3870, which began in May 2014, and the highs of 2018), 1.2200, 1.2260. More distant growth targets are located at resistance levels 1.2340, 1.2450, 1.2500, 1.2580 (Fibonacci level 61.8%), 1.2600.
In the meantime, the technical indicators OsMA and Stochastic on the 1-hour, 4-hour, daily, weekly charts signal a strong downward impulse and recommend short positions.
Support levels: 1.1940, 1.1880, 1.1780, 1.1710, 1.1610
Resistance levels: 1.2010, 1.2070, 1.2122, 1.2128, 1.2180, 1.2260, 1.2340, 1.2450, 1.2580, 1.2600
Trading Recommendations
Sell Stop 1.1910. Stop-Loss 1.1960. Take-Profit 1.1880, 1.1780, 1.1710, 1.1610
Buy Stop 1.1960. Stop-Loss 1.1910. Take-Profit 1.2010, 1.2070, 1.2122, 1.2128, 1.2180, 1.2260, 1.2340, 1.2450, 1.2580, 1.2600

