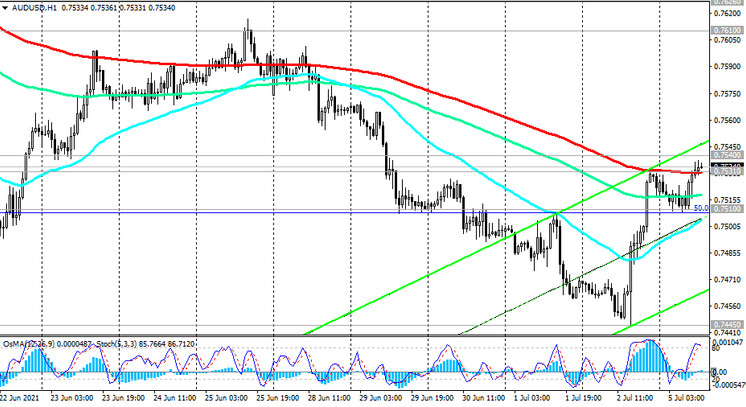
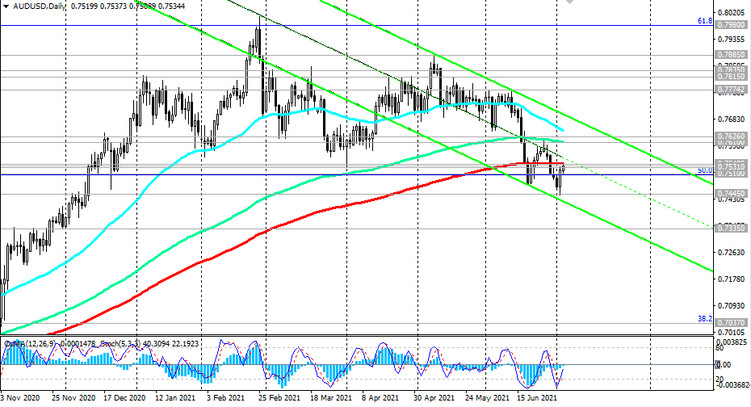
Last week, the AUD / USD pair broke through the key long-term support level 0.7540 (ЕМА200 on the daily chart) on expectations of an earlier start to curtailment of the Fed's stimulus policy and against the background of strengthening USD.
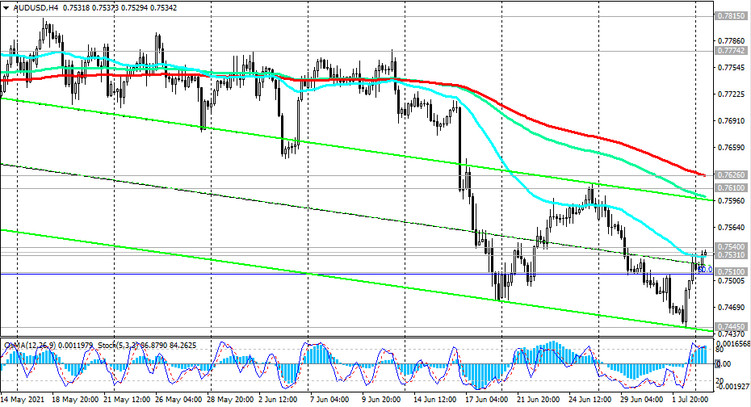
In early July, AUD / USD dropped to the mark and local support level of 0.7445.
However, having bounced off this level, the pair rose and returned to the zone of the key level 0.7540.
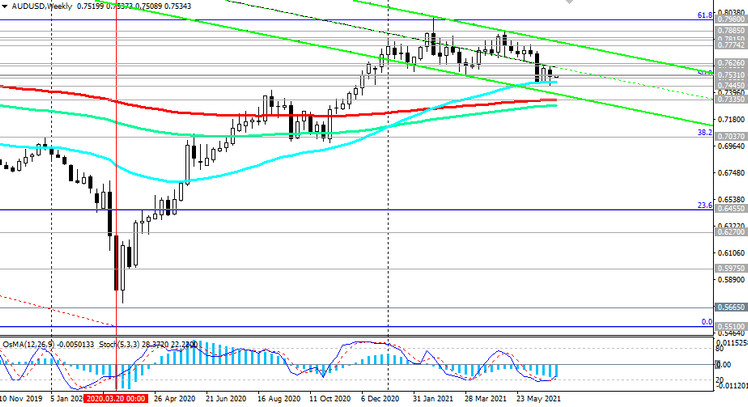
A breakdown of this level upwards will mean the restoration of the long-term upward dynamics of AUD / USD, and a breakdown of the resistance levels 0.7610 (ЕМА144 on the daily chart) and 0.7626 (ЕМА200 on the 4-hour chart) will become a confirmation signal for the resumption of long positions with targets at the resistance level 0.7835 (ЕМА200 on the monthly chart) and further at 0.8100, 0.8160, 0.8200.
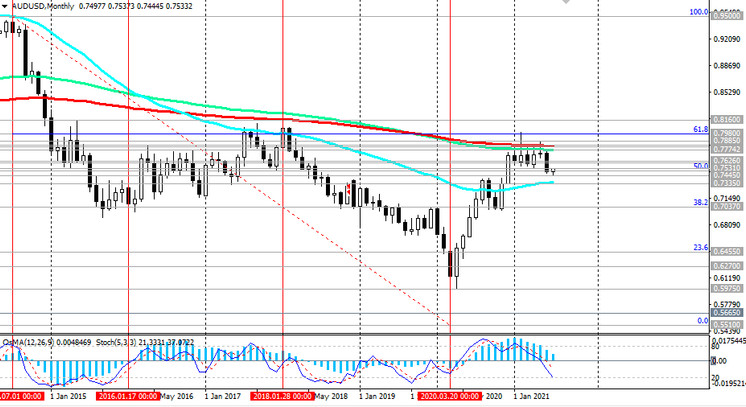
In an alternative scenario, the decline in AUD / USD will resume. A signal for this will be a breakdown of the support levels 0.7531 (ЕМА200 on the 1-hour chart), 0.7510 (50% Fibonacci retracement to the wave of the pair's decline from 0.9500 in July 2014 to 2020 lows near 0.5510).
A breakdown of the support level 0.7335 (ЕМА200 and the lower border of the descending channel on the weekly chart) will finally return AUD / USD into a long-term downtrend.
Support levels: 0.7531, 0.7510, 0.7445, 0.7335
Resistance levels: 0.7540, 0.7610, 0.7626, 0.7742, 0.7815, 0.7835, 0.7885, 0.8000, 0.8160, 0.8200
Trading Recommendations
Sell Stop 0.7505. Stop-Loss 0.7545. Take-Profit 0.7445, 0.7335
Buy Stop 0.7545. Stop-Loss 0.7505. Take-Profit 0.7610, 0.7626, 0.7742, 0.7815, 0.7835, 0.7885, 0.8000, 0.8160, 0.8200

