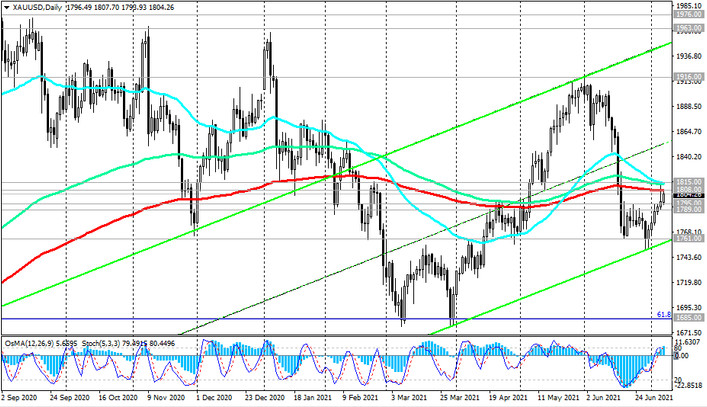
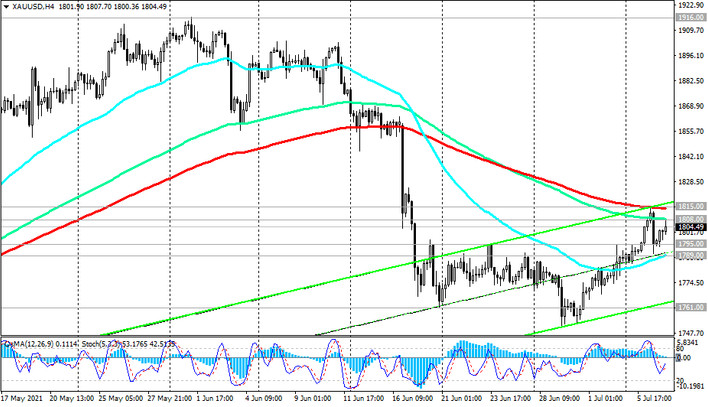
As we noted above, XAU / USD came close to the long-term key support / resistance level 1808.00 (ЕМА200 on the daily chart).

Just above, at 1815.00, there is an important resistance level (EMA200 on the 4-hour chart, EMA144 and EMA50 on the daily chart). Its breakdown will become a confirmation signal for the resumption of long positions in XAU / USD.

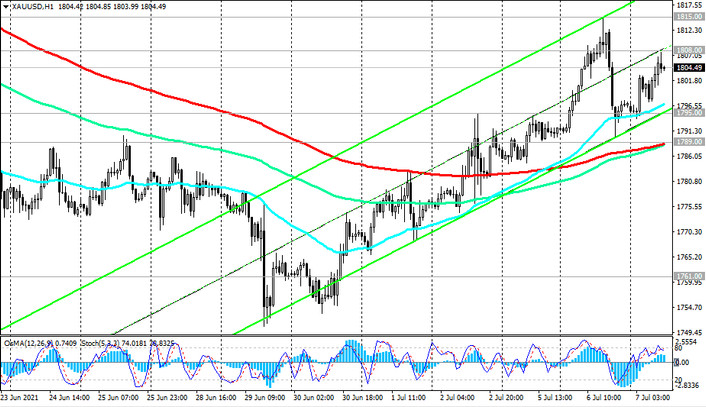
OsMA and Stochastic indicators on 1-hour and daily charts speak in favor of such a development of events.

Against the backdrop of rising inflation and maintaining the neutral position of the Fed, the XAU / USD pair has the potential for further growth. In this case, the targets will be the marks 1916.00, 1963.00, 1976.00 (local highs), 2000.00
In the alternative scenario, XAU / USD will strengthen the downward trend, and the downward correction may continue inside the downward channel on the weekly chart, the lower border of which passes through the support level 1645.00 (ЕМА144 on the weekly chart).
A signal for the development of a scenario for a decline in XAU / USD will be a breakdown of an important short-term support level 1789.00 (ЕМА200 on the 1-hour chart), and the nearest target is the support level 1761.00 (local lows) and further - the mark of 1685.00 and the Fibonacci level 61.8% (correction to the growth wave since November 2015 and the mark of 1050.00).
Support levels: 1795.00, 1789.00, 1761.00, 1685.00, 1645.00, 1580.00, 1560.00
Resistance levels: 1808.00, 1815.00, 1900.00, 1916.00, 1963.00, 1976.00, 2000.00, 2010.00
Trading recommendations
Sell Stop 1792.00. Stop-Loss 1810.00. Take-Profit 1789.00, 1761.00, 1685.00, 1645.00, 1580.00, 1560.00
Buy Stop 1810.00. Stop-Loss 1792.00. Take-Profit 1815.00, 1900.00, 1916.00, 1963.00, 1976.00, 2000.00, 2010.00


