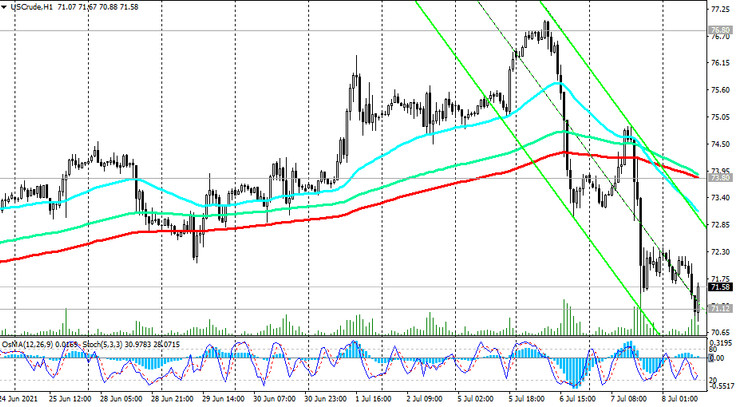
On Tuesday, the price of WTI crude oil broke through the important short-term support level 73.80 (ЕМА200 on the 1-hour chart), and today continues to develop a downward correction movement, finding support at 71.12 level (ЕМА200 on the 4-hour chart and the middle of the ascending channel on the daily graph).
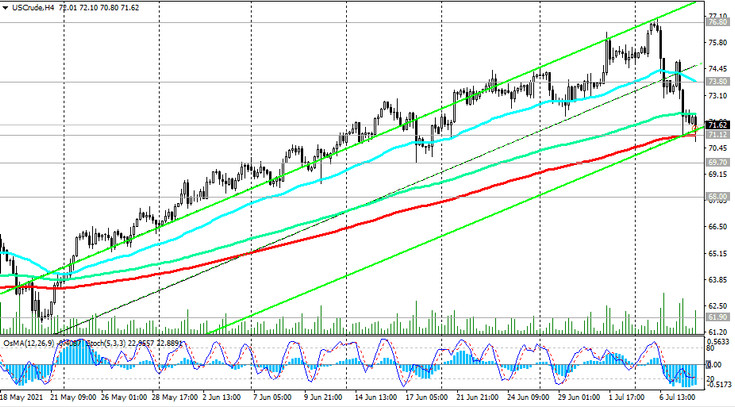
In case of its breakdown, the price may decline to the support level 69.70 (ЕМА50 on the daily chart).
Above the support levels 69.70, 71.12, one should still give preference to long positions. Above them, the price maintains a long-term positive trend.
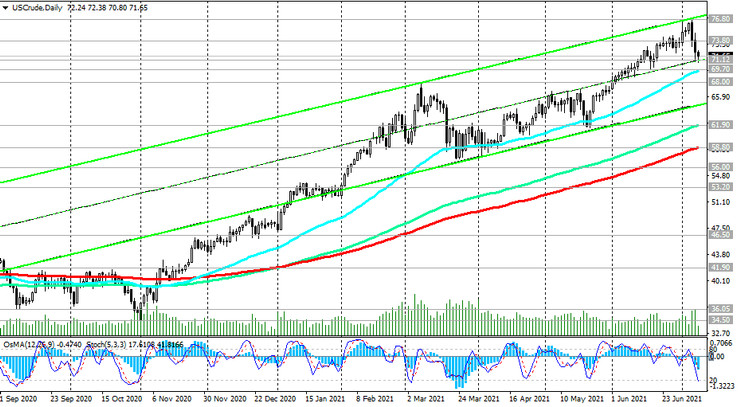
However, a breakdown of the 69.70 support level could trigger a deeper corrective decline to the local support level 68.00 (February highs).
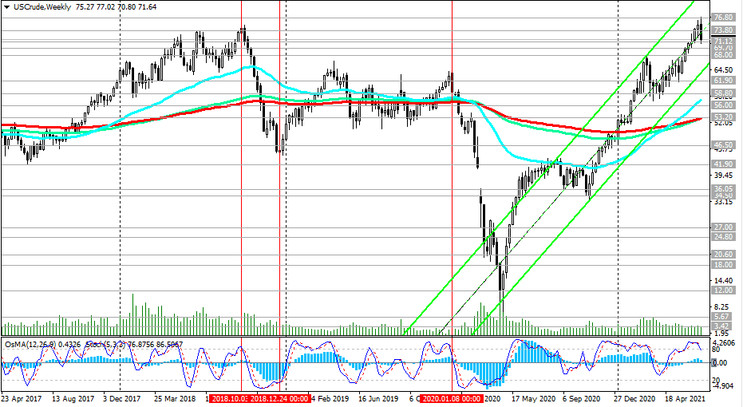
In any case, above the key support levels 58.80 (ЕМА200 on the daily), 56.00 (ЕМА200 on the monthly chart), a long-term upward trend prevails.
Only their breakdown can increase the risks of breaking the bullish trend. Therefore, the decline to the support levels 71.12, 69.70 provides an opportunity to build up long positions.
WTI oil is traded in the bull market zone. A breakdown of the local resistance level 76.80 will become a confirmation signal for further price growth.
Support levels: 71.12, 69.70, 69.00, 68.00, 66.00, 64.00, 61.90, 60.00, 58.80, 56.00, 53.20
Resistance levels: 73.80, 76.80
Trading recommendations
Sell Stop 70.75. Stop-Loss 72.45. Take-Profit 69.70, 69.00, 68.00, 66.00, 64.00, 61.90, 60.00, 58.80, 56.00, 53.20
Buy Stop 72.45. Stop-Loss 70.75. Take-Profit 73.80, 76.80