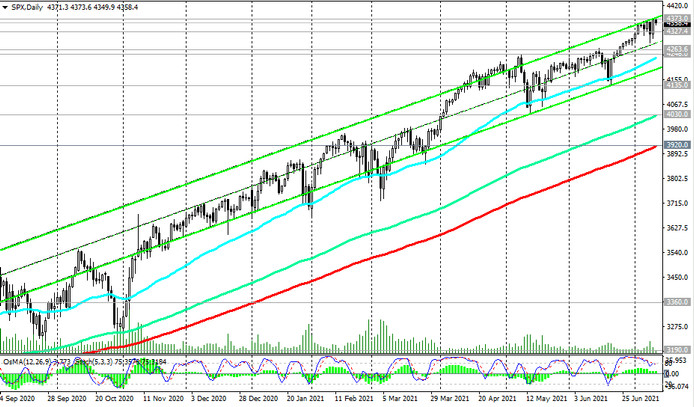
Since March 2020, a new period of the S&P 500 bullish trend has begun after the Fed and other major world central banks launched an unprecedented policy of stimulating the economy affected by the coronavirus. The S&P 500 continues to trade within the ascending channel on the daily chart, in the zone above the key support levels 3920.0 (EMA200 on the daily chart), 3190.0 (EMA200 on the weekly chart).
Last week, S&P 500 futures reached new record highs, and at the beginning of today's Asian session, they managed to rewrite them, reaching a new record level 4373.0. At the beginning of today's European session, S&P 500 futures are traded just below this record level, but they retain the potential for further growth.
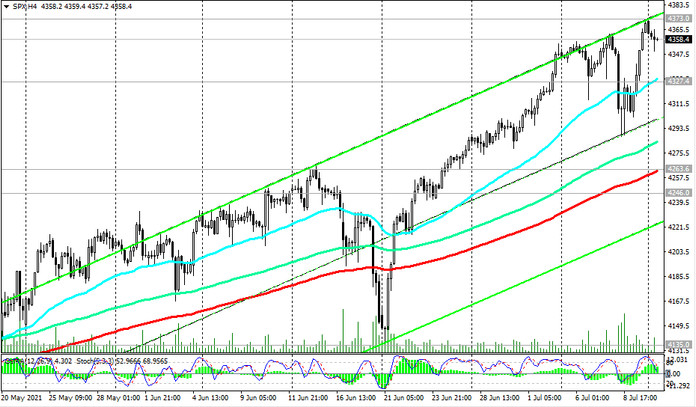
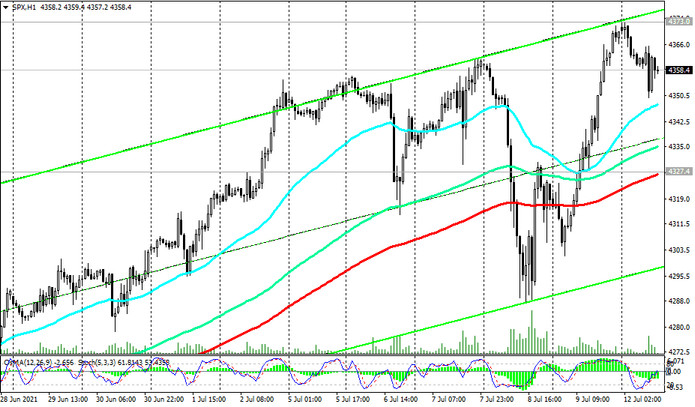
In the zone above the important short-term support level 4327.0, long positions on the S&P 500 are not in danger. A breakdown of this support level can be a signal for a deeper correction to the support levels 4263.0 (EMA200 on the 4-hour chart), 4246.0 (May highs).

However, a confirmed breakdown of the local support level 4135.0 (June lows) may cause a further decline to the support levels 4030.0 (EMA144 on the daily chart), 3920.0 (EMA200 on the daily chart).
Nevertheless, in the current situation, long positions are still preferred, and a breakdown of the local resistance level 4373.0 will be a signal for building up long positions.
Support levels: 4327.0, 4263.0, 4246.0, 4135.0, 4030.0, 3920.0
Resistance levels: 4373.0, 4400.0
Trading recommendations
Sell Stop 4344.0. Stop-Loss 4366.0. Goals 4327.0, 4263.0, 4246.0, 4135.0, 4030.0, 3920.0
Buy Stop 4366.0. Stop-Loss 4344.0. Goals 4373.0, 4400.0, 4500.0