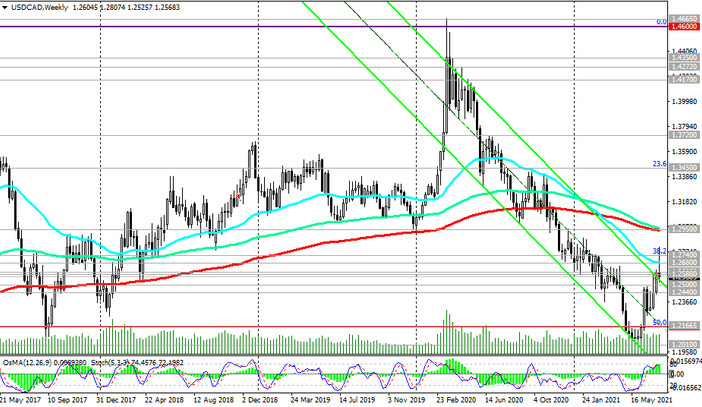
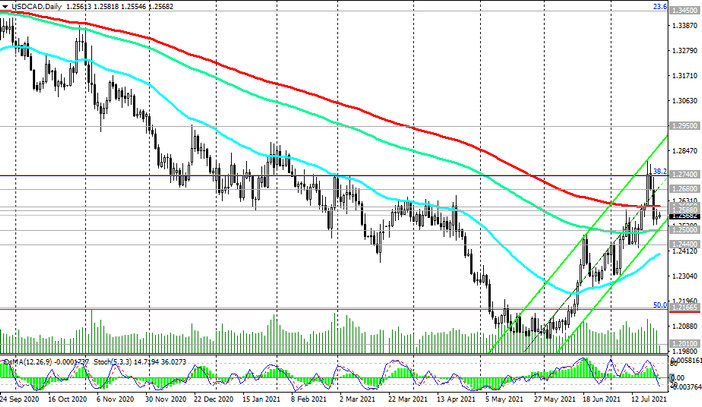
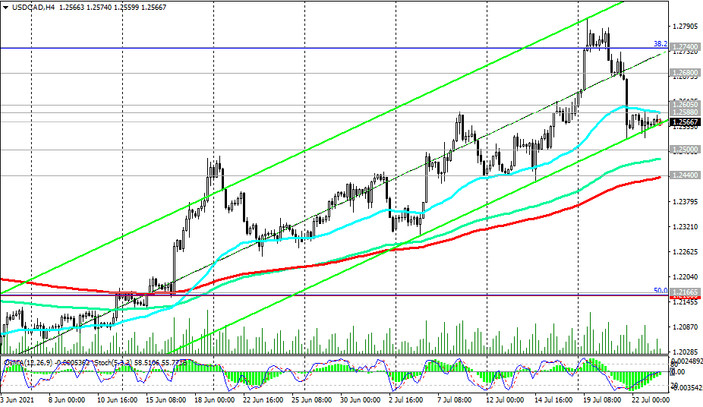
As we noted above, the US dollar continues to strengthen amid rising US inflation and rising fears about the coronavirus pandemic. In July, the USD / CAD pair is growing for the second month in a row, making an attempt to break through into the zone above the long-term resistance level 1.2605 (ЕМА200 on the daily chart).

At the moment (from a technical point of view) there is still a possibility that USD / CAD will return to a bear market. This will be evidenced by the breakdown of the key long-term support level 1.2440 (ЕМА200 on the monthly chart).

At the same time, a rise into the zone above the resistance level 1.2605 (ЕМА200 on the daily chart) will increase the chances, and a breakout of the key long-term resistance level 1.2950 (ЕМА200 on the weekly chart) will finally return USD / CAD on to a long-term bull market.

A breakout of the resistance level 1.2740 (Fibonacci level 38.2% of the downward correction in the wave of USD / CAD growth from 0.9700 to 1.4600) will increase the likelihood of USD / CAD rising towards resistance 1.2950. Long positions are still preferable in the current situation.
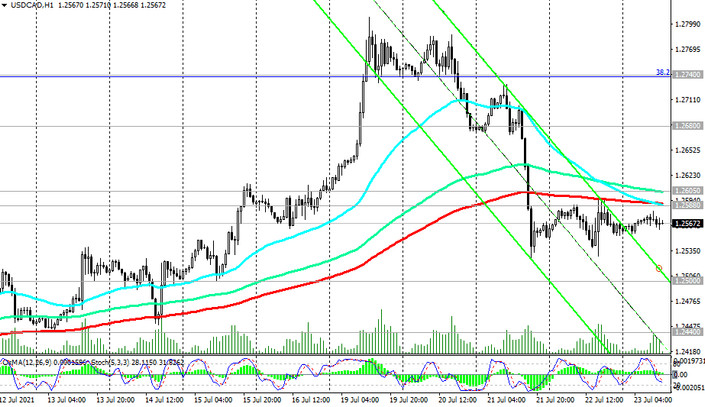
The signal for their building up will be the breakdown of the resistance levels 1.2588 (EMA200 on the 1-hour chart), 1.2605.

In an alternative scenario, the breakdown of the support levels 1.2500 (ЕМА144 on the daily chart), 1.2440 will be a signal for the resumption of short positions.
Support levels: 1.2500, 1.2440, 1.2275, 1.2165, 1.2100, 1.2010
Resistance levels: 1.2588, 1.2605, 1.2680, 1.2740, 1.2950
Trading scenarios
Sell Stop 1.2520. Stop-Loss 1.2615. Take-Profit 1.2500, 1.2440, 1.2275, 1.2165, 1.2100, 1.2010
Buy Stop 1.2615. Stop-Loss 1.2520. Take-Profit 1.2680, 1.2700, 1.2740, 1.2950


