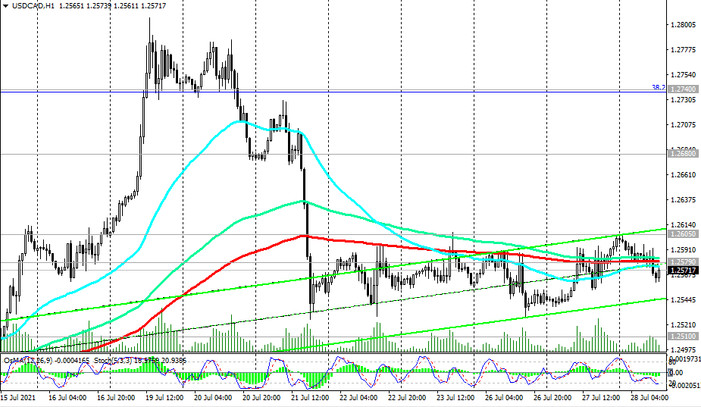
In the past few days, USD / CAD growth has stalled. For 5 days in a row, the pair has been trading in the zone below the key resistance level 1.2605 (ЕМА200 on the daily chart), remaining in the bear market zone.
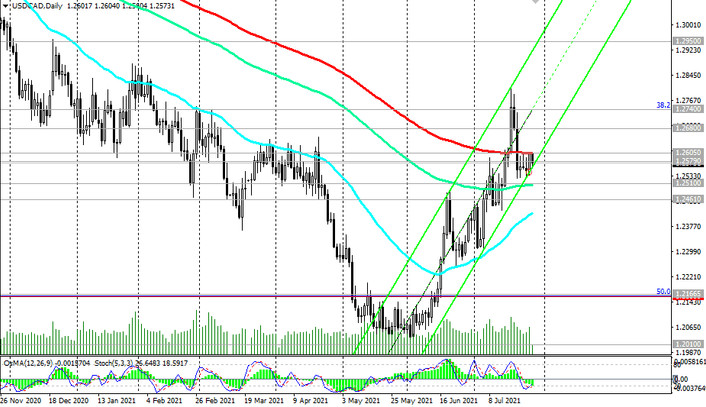
This month, USD / CAD has already attempted to break through this level and further advance within the upward channel on the daily chart.
However, the pair's growth was stopped by the resistance levels 1.2740 (Fibonacci level 38.2% of the downward correction in the wave of USD / CAD growth from 0.9700 to 1.4600), 1.2800.
In case of breakdown of the support levels 1.2510 (ЕМА144 on the daily chart), 1.2461 (ЕМА200 on the 4-hour chart), USD / CAD will go deep into the descending channel on the weekly chart and to support levels 1.2165 (50% Fibonacci level), 1.2010 (2021 lows).
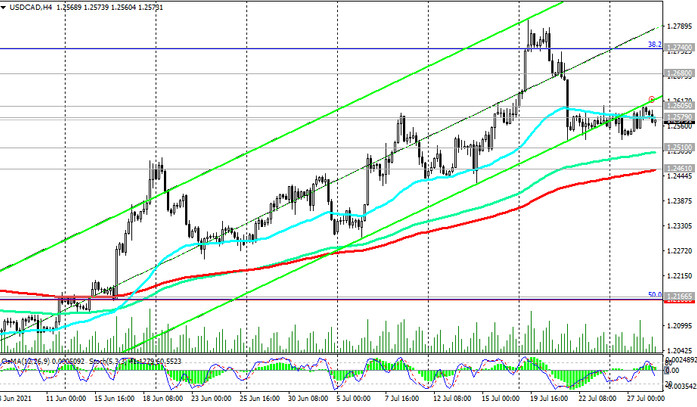
In an alternative scenario, a confirmed breakdown of the resistance levels 1.2740, 1.2800 will create preconditions for further growth of USD / CAD towards the resistance level 1.2950 (ЕМА200 on the weekly chart), which will return USD / CAD onto a long-term bull market.

Support levels: 1.2510, 1.2461, 1.2275, 1.2165, 1.2100, 1.2010
Resistance levels: 1.2579, 1.2605, 1.2680, 1.2740, 1.2950
Trading scenarios
Sell Stop 1.2490. Stop-Loss 1.2615. Take-Profit 1.2460, 1.2440, 1.2275, 1.2165, 1.2100, 1.2010
Buy Stop 1.2615. Stop-Loss 1.2490. Take-Profit 1.2680, 1.2740, 1.2950