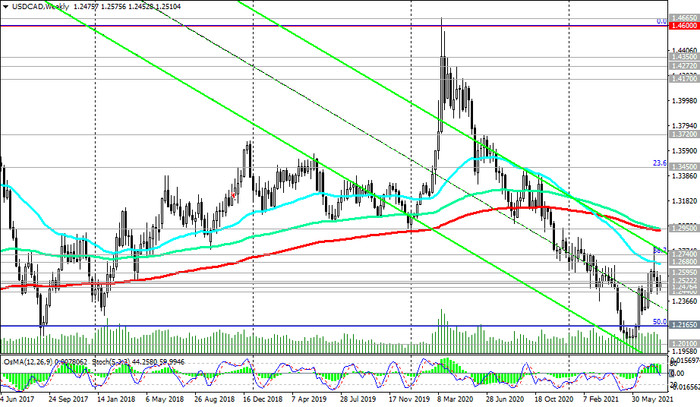
At the time of this article publication, USD / CAD is traded near the 1.2510 mark, through which the long-term key support level (ЕМА200 on the monthly chart) passes, separating the bull market from the bear market.

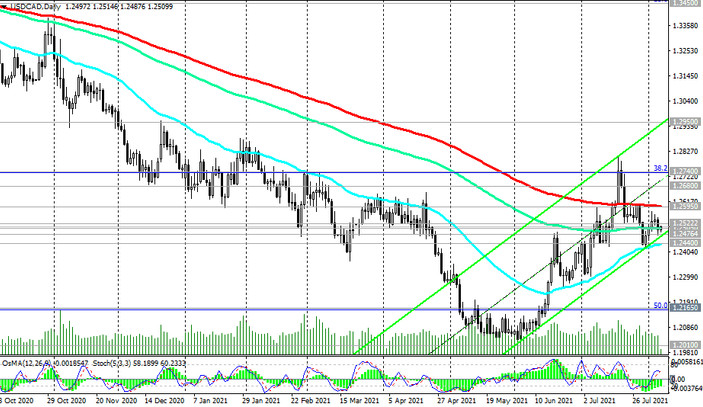
At the same time, a more positive picture is emerging on the daily chart. Despite the fact that USD / CAD is in the zone below the key resistance level 1.2595 (ЕМА200 on the daily price chart), it found support at the important level 1.2505 (ЕМА144 on the daily chart).

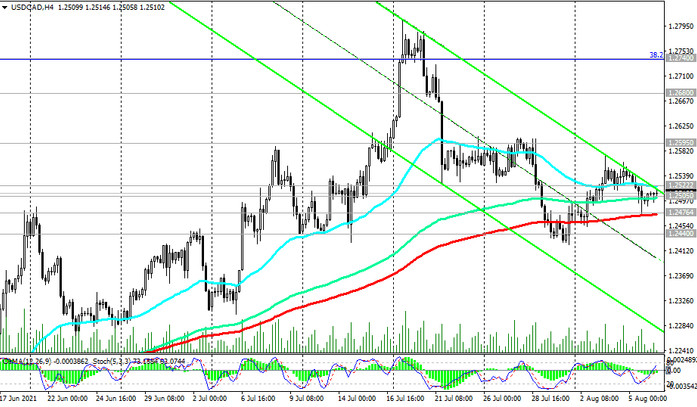
Slightly below is another important support level 1.2476 (ЕМА200 on the 4-hour chart), through which also the lower line of the ascending channel on the daily chart passes.

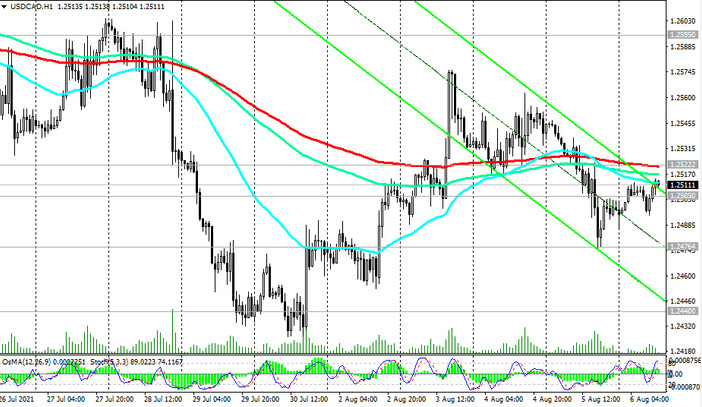
The first signal for buying will be a breakdown of the short-term resistance level 1.2522 (ЕМА200 on the 1-hour chart).

Growth into the zone above the resistance level 1.2595 will confirm the recovery of the bullish dynamics of USD / CAD with the prospect of growth to the resistance levels 1.2740 (38.2% Fibonacci level of the downward correction in the wave of USD / CAD growth from the level of 0.9700 to the level of 1.4600), 1.2950 (EMA200 on the weekly chart).
In an alternative scenario, the first signal for selling USD / CAD will be a breakdown of the support level 1.2476. A breakdown of the support level 1.2440 (ЕМА50 on the daily chart and local lows) will confirm the return of USD / CAD into the long-term downtrend that formed at the end of March 2020.
Support levels: 1.2476, 1.2440, 1.2165, 1.2100
Resistance levels: 1.2522, 1.2595, 1.2680, 1.2740, 1.2825, 1.2950
Trading scenarios
Sell Stop 1.2465. Stop-Loss 1.2535. Take-Profit 1.2440, 1.2330, 1.2200, 1.2165, 1.2100
Buy Stop 1.2535. Stop-Loss 1.2465. Take-Profit 1.2595, 1.2680, 1.2740, 1.2825, 1.2950


