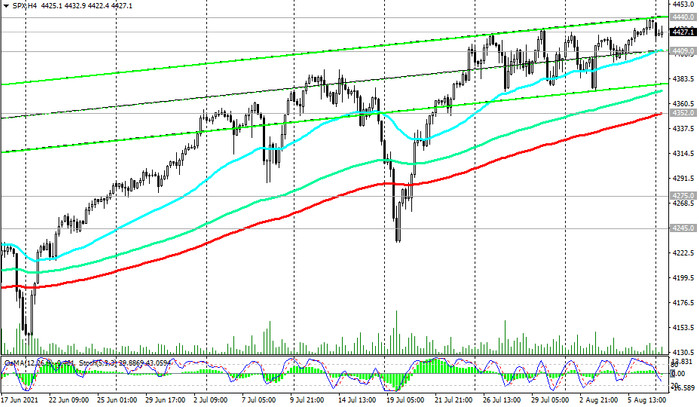
As we noted above, the US stock market has been showing bullish dynamics for many years. Thus, the S&P 500 index last week reached a new all-time high near 4440.0 mark, and at the beginning of the new week, the S&P 500 remains close to this record mark.
At the start of today's European session, S&P 500 futures were traded near 4427.0, just below this all-time high of 4440.0, with potential for further gains. A signal for building up long positions will be a breakdown of the local resistance level 4440.0.
Growth will continue until the S&P 500 "gropes" new levels of resistance or the Fed begins to roll back its stimulus policy.
In an alternative scenario, a downward correction of the S&P 500 will begin.
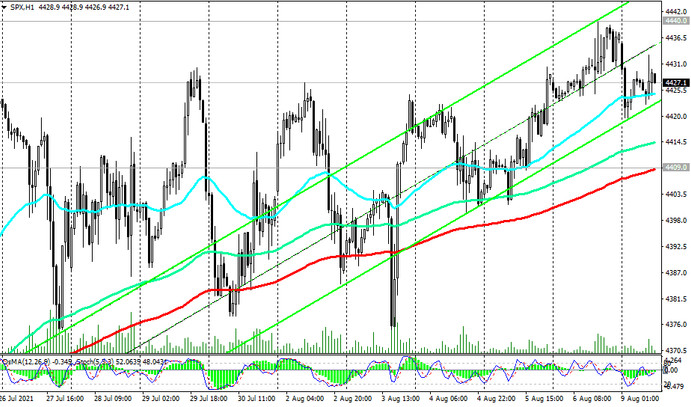
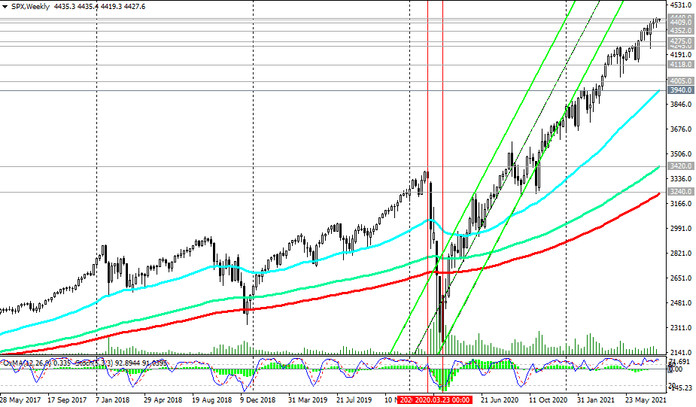
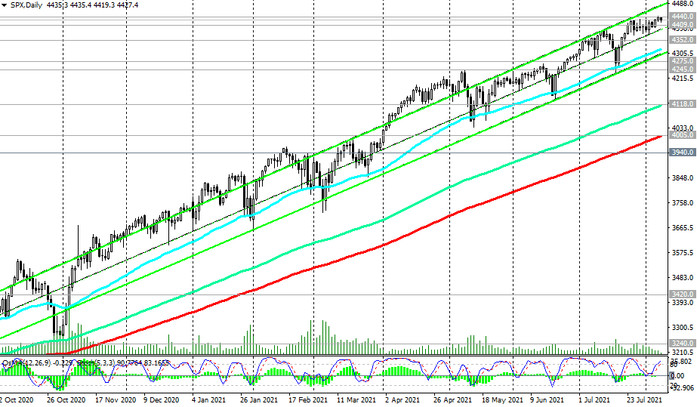
The breakdown of the short-term important support level 4409.0 (EMA200 on the 1-hour chart) can be a signal for the beginning of the implementation of this scenario. A breakdown of support levels 4300.0 (ЕМА50 and the lower line of the ascending channel on the daily chart), 4245.0 (May highs) may cause a deeper correction and a further decline to support levels 4118.0 (ЕМА144 on the daily chart), 4005.0 (ЕМА200 on the daily chart).
Nevertheless, in the current situation, long positions are still preferred.
Support levels: 4409.0, 4352.0, 4275.0, 4245.0, 4118.0, 4005.0, 3940.0
Resistance levels: 4440.0
Trading recommendations
Sell Stop 4390.0. Stop-Loss 4442.0. Targets 4352.0, 4275.0, 4245.0, 4118.0, 4005.0, 3940.0
Buy Stop 4442.0. Stop-Loss 4390.0. Targets 4500.0, 4600.0, 4700.0