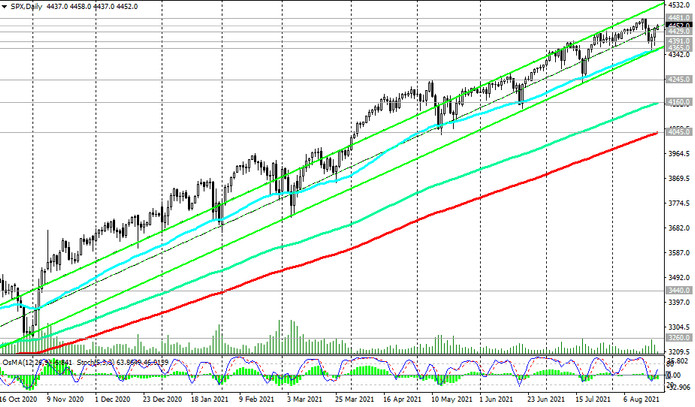
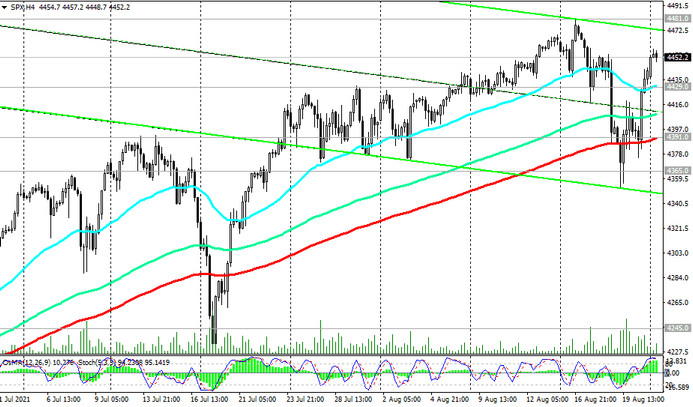
The S&P 500 reached a new all-time high last week near 4481.0, showing bullish dynamics for many years. At the beginning of the new week, the growth of S&P 500 futures is observed again after their correctional decline at the end of last week to the support level 4365.0 (ЕМА50 and the lower line of the ascending channel on the daily chart).
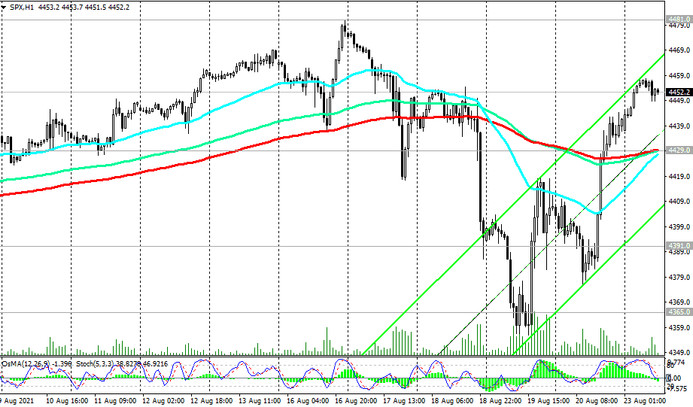
Currently, S&P 500 futures are traded in the middle of the upward channel on the daily chart, above the important short-term support levels 4391.0 (EMA200 on the 4-hour chart), 4429.0 (EMA200 on the 1-hour chart).
A breakdown of the local resistance level 4481.0 will become a confirmation signal for a build-up of long positions.
In an alternative scenario, a confirmed breakout of the support level 4365.0 may trigger a deeper correction to the local support level 4245.0. Its breakdown, in turn, will be a signal for a further decline to support levels 4160.0 (ЕМА144 on the daily chart), 4045.0 (ЕМА200 on the daily chart). The first signal for the implementation of this scenario may be a breakdown of the support level 4429.0.
Nevertheless, in the current situation, long positions are still preferred.
Support levels: 4429.0, 4391.0, 43656.0, 4245.0, 4160.0, 4045.0
Resistance levels: 4481.0
Trading recommendations
Sell Stop 4420.0. Stop-Loss 4485.0. Targets 4391.0, 43656.0, 4245.0, 4160.0, 4045.0
Buy by market, Buy Stop 4485.0. Stop-Loss 4420.0. Targets 4500.0, 4600.0, 4700.0