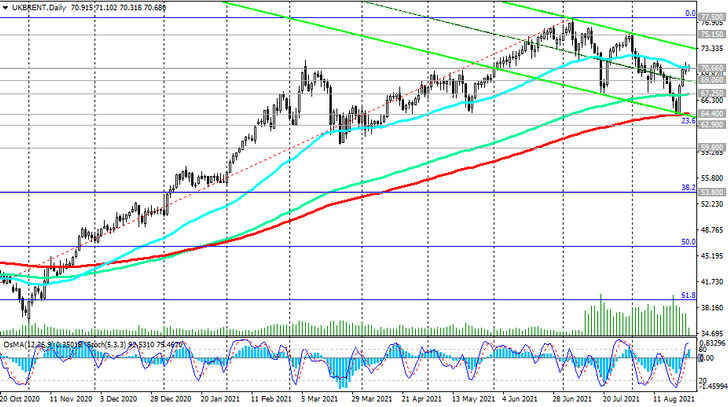
Having reached at the end of last week a local 4-month low of 64.50 and a long-term support level (ЕМА200 and the lower line of the descending channel on the daily chart), the price of Brent crude turned up.
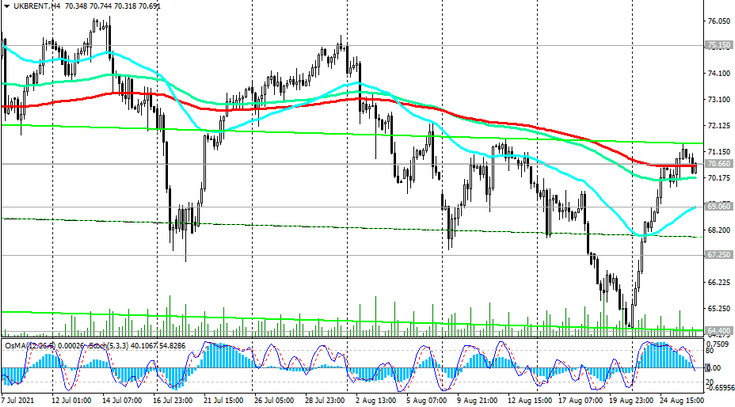
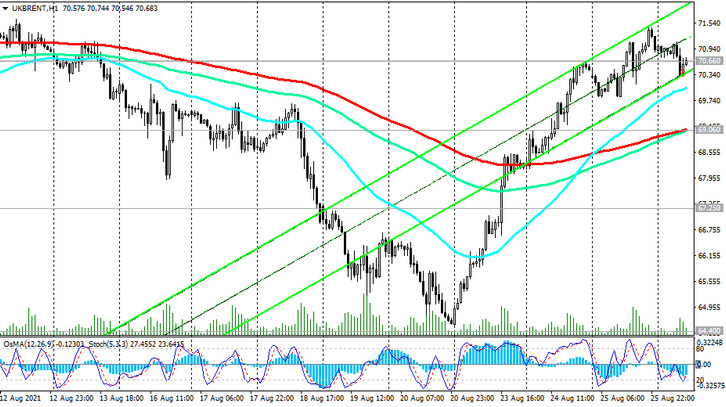
At the time of publication of this article, Brent crude oil futures were traded near a strong resistance level (EMA50 on the daily chart, EMA200 on the 4-hour chart) and mark of $ 70.66 per barrel.
Nevertheless, technical indicators OsMA and Stochastic draw a contradictory picture at different time intervals.
Below the resistance level 70.66, the downward corrective price dynamics remains. Therefore, the breakdown of the short-term support level 69.06 (ЕМА200 on the 1-hour chart) will be a signal for the resumption of short positions.
In case of a breakdown of the support levels 64.40 (ЕМА200 on the daily chart), 62.90 (Fibonacci level 23.6% of the correction to the wave of growth from record lows after the collapse of prices in March 2020), the decline may intensify. A breakdown of the key long-term support level 59.80 (ЕМА200 on the weekly chart) will increase the negative dynamics and the likelihood of a return into a long-term downtrend.
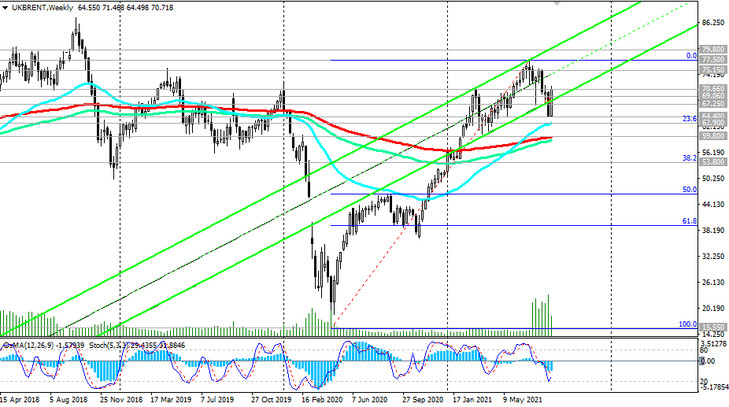
In an alternative scenario and in the event of a confirmed breakdown of the resistance level 70.66, corrective growth may turn into a resumption of long-term upward dynamics with targets near the resistance levels 75.15, 77.50 (highs since November 2018), 79.80 (ЕМА200 on the monthly chart).
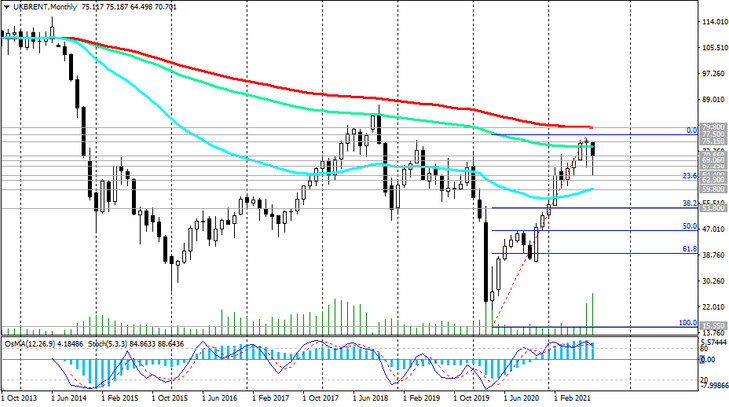
Support levels: 69.06, 67.25, 64.40, 62.90, 59.80, 53.80
Resistance levels: 70.66, 75.15, 77.50, 79.80
Trading recommendations
Sell Stop 69.80. Stop-Loss 71.50. Take-Profit 69.06, 67.25, 64.40, 62.90, 59.80, 53.80
Buy Stop 71.50. Stop-Loss 69.80. Take-Profit 75.15, 77.50, 79.80

