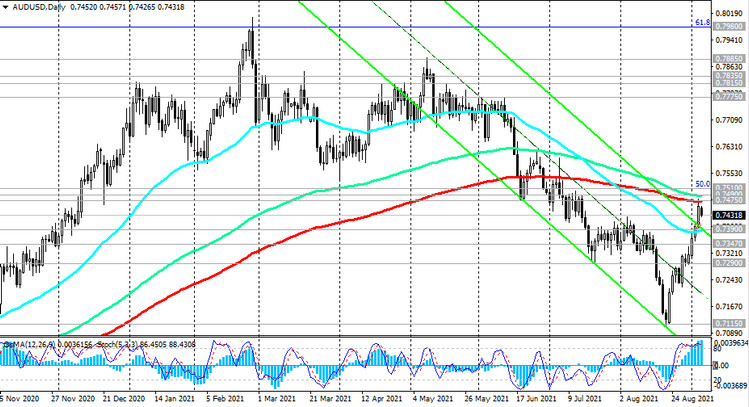
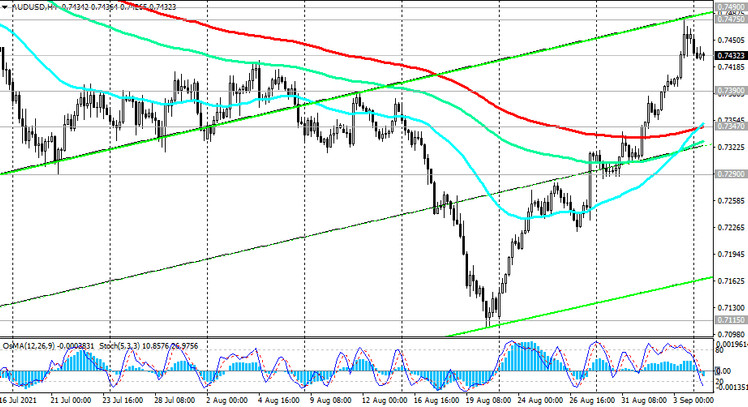
At the time of publication of this article, AUD / USD is traded near the 0.7432 mark, just below the key resistance levels 0.7475 (ЕМА200 on the daily chart), 0.7490 (ЕМА144 on the daily chart), 0.7510 (50% Fibonacci retracement to the wave of the pair's decline from 0.9500 in July 2014 to 2020 lows near 0.5510).

The breakdown of these resistance levels will indicate the resumption of the long-term upward trend in AUD / USD and its return to the bullish long-term market.
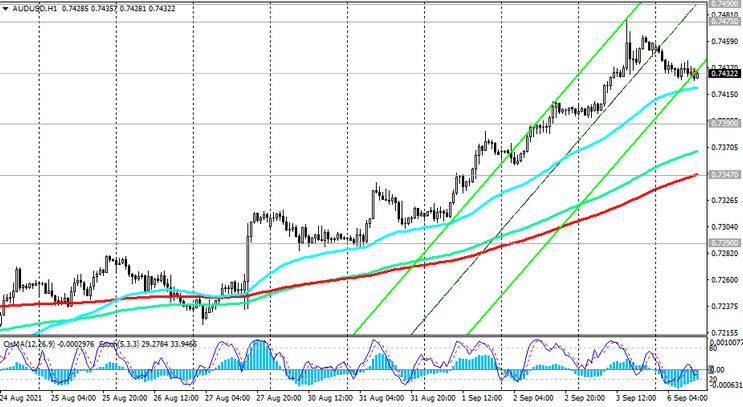
In an alternative scenario, the first signal to resume the downtrend will be a breakdown of the short-term support level 0.7421 (ЕМА200 on the 15-minute chart).

Breakdown of the support levels 0.7390 (the upper line of the descending channel and EMA50 on the daily chart), 0.7347 (ЕМА200 on the 1-hour and 4-hour charts) will confirm this scenario, and AUD / USD will go deep into the descending channel on the daily chart, towards its lower border and support level 0.7037 (Fibonacci level 38.2%).

Support levels: 0.7421, 0.7390, 0.7347, 0.7290, 0.7115, 0.7037
Resistance levels: 0.7475, 0.7490, 0.7510
Trading Recommendations
Sell-Stop 0.7415. Stop-Loss 0.7480. Take-Profit 0.7390, 0.7347, 0.7290, 0.7115, 0.7037
Buy Stop 0.7480. Stop-Loss 0.7415. Take-Profit 0.7490, 0.7510, 0.7775, 0.7815, 0.7835


