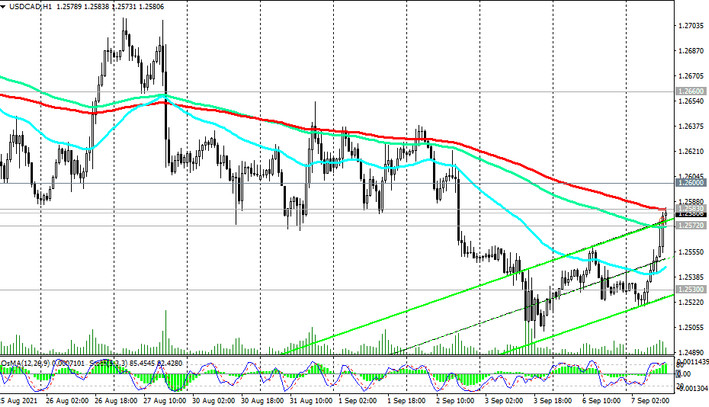
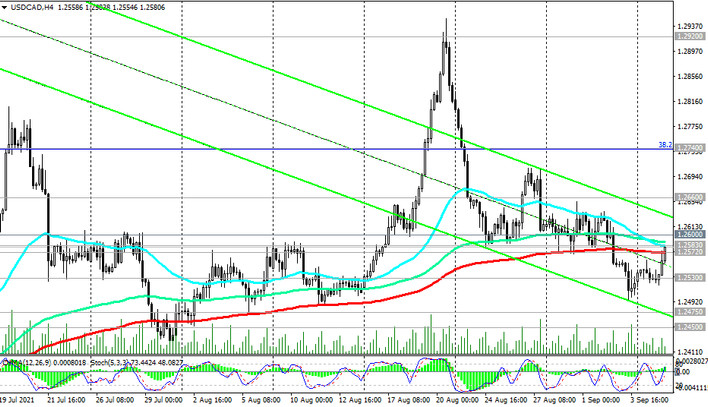
As of this writing, USD / CAD is traded near the strong short-term resistance level 1.2583 (EMA200 on the 1-hour chart) and the strong short-term support level 1.2572 (EMA200 on the 4-hour chart).
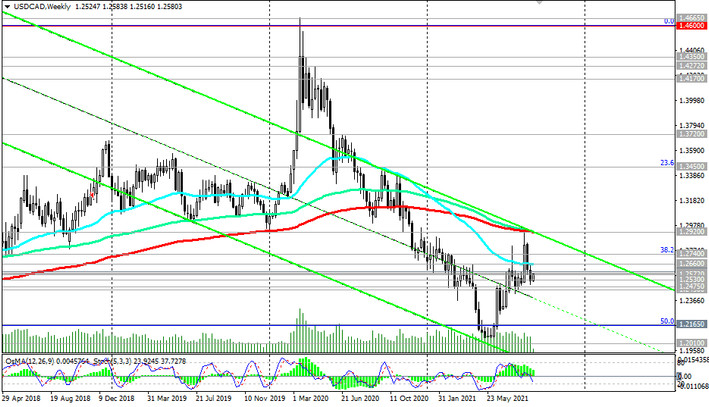
The key long-term resistance level (ЕМА200 on the daily chart) passes through the mark of 1.2600. Its breakdown will create preconditions for further growth of USD / CAD towards another key resistance level 1.2920 (ЕМА200 and the upper line of the descending channel on the weekly chart). A return into the zone above this resistance level would mean a recovery in the long-term bullish trend of USD / CAD.
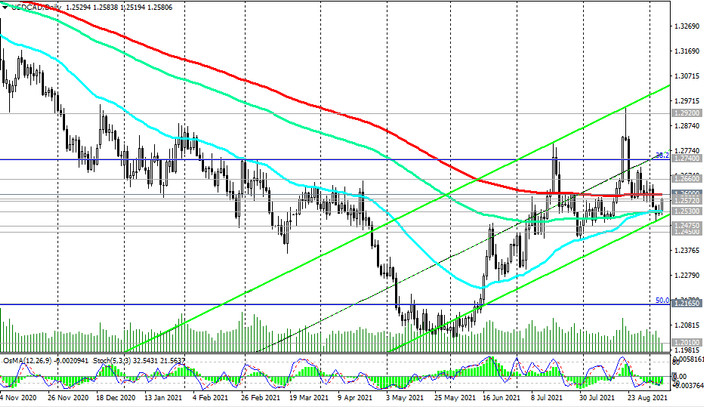
In an alternative scenario, the price will break through the strong support level 1.2530 (ЕМА50, ЕМА144 and the lower border of the ascending channel on the daily chart) and resume the downward trend with targets at 15-year lows and 1.2000 mark, near which USD / CAD was in early June.
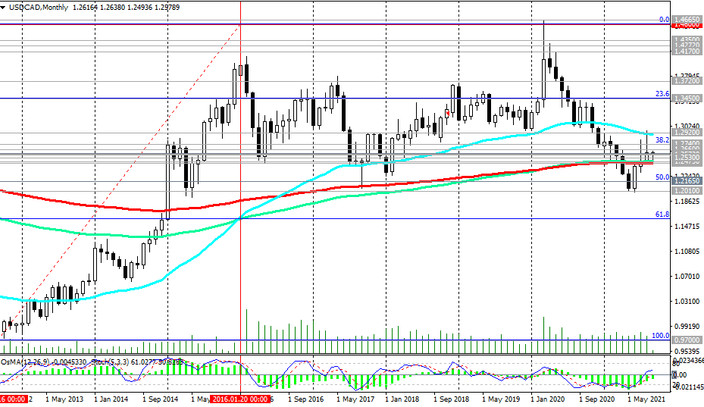
The first signal for the implementation of this scenario will be the return of USD / CAD into the zone below the support level 1.2572, and the breakdown of the support level 1.2450 (ЕМА200 on the monthly chart) will confirm the return of USD / CAD into the long-term downtrend that formed at the end of March 2020.
Support levels: 1.2572, 1.2530, 1.2475, 1.2450
Resistance levels: 1.2583, 1.2600, 1.2660, 1.2740, 1.2825, 1.2930
Trading scenarios
Sell Stop 1.2550. Stop-Loss 1.2610. Take-Profit 1.2530, 1.2475, 1.2450, 1.2330, 1.2200, 1.2165, 1.2100
Buy Stop 1.2610. Stop-Loss 1.2550. Take-Profit 1.2660, 1.2740, 1.2825, 1.2930