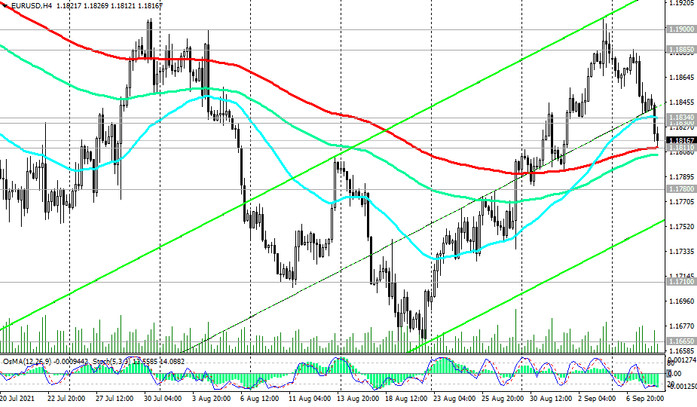
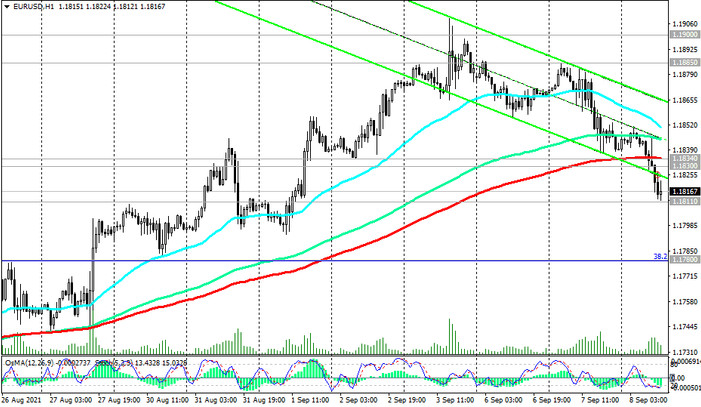
At the start of today's European session, EUR / USD is traded near an important support level (EMA200 on the 4-hour chart), passing through 1.1811, declining for the third day in a row.

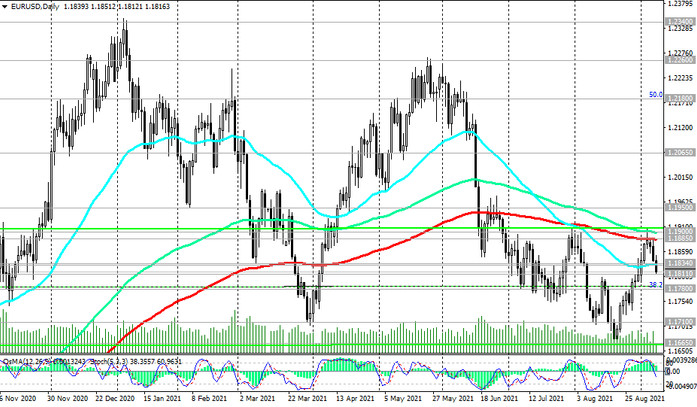
Breakdown of the zone of strong and key resistance levels 1.1885 (ЕМА200 on the daily chart), 1.1900 (ЕМА144 on the daily chart), thus, did not take place.

Below these resistance levels, the long-term negative dynamics of EUR / USD remains.
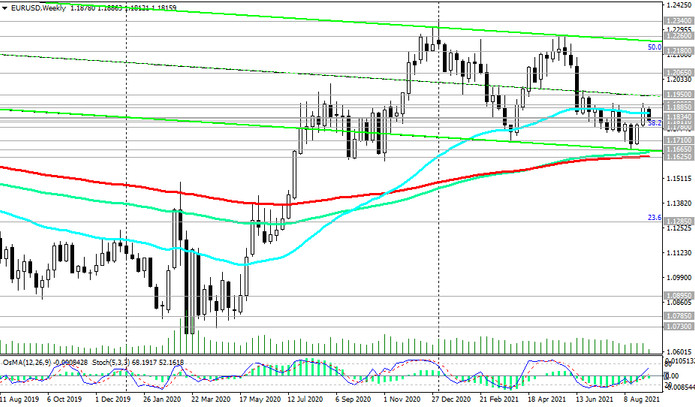
Therefore, the breakdown of the support level 1.1811 will become a confirmation signal indicating the resumption of the bearish trend in EUR / USD. Break of the long-term support level 1.1625 (ЕМА200 on the weekly chart) will finally return the pair to the long-term bear market zone.

In the alternative scenario and after the breakdown of the resistance levels 1.1830 (ЕМА50 on the daily chart), 1.1834 (ЕМА200 on the 1-hour chart), the EUR / USD will resume growth. In case of a confirmed breakdown of the resistance levels 1.1885, 1.1900, we can expect further growth towards the key resistance level 1.2065 (ЕМА200 on the monthly chart). Its breakdown will return EUR / USD to the bull market zone with the prospect of its further growth to the resistance levels 1.2180 (Fibonacci level of 50% of the upward correction in the wave of the pair's decline from the level of 1.3870, which began in May 2014, and the highs of 2018), 1.2260, 1.2340, 1.2450, 1.2500, 1.2580 (61.8% Fibonacci level), 1.2600.
Support levels: 1.1811, 1.1780, 1.1710, 1.1665, 1.1625
Resistance levels: 1.1830, 1.1834, 1.1885, 1.1900, 1.1950, 1.2065, 1.2180, 1.2260, 1.2340, 1.2450, 1.2580, 1.2600
Trading Recommendations
Sell Stop 1.1795. Stop-Loss 1.1845. Take-Profit 1.1780, 1.1710, 1.1665, 1.1625
Buy Stop 1.1845. Stop-Loss 1.1795. Take-Profit 1.1885, 1.1900, 1.1950, 1.2065, 1.2180, 1.2260, 1.2340, 1.2450, 1.2580, 1.2600


