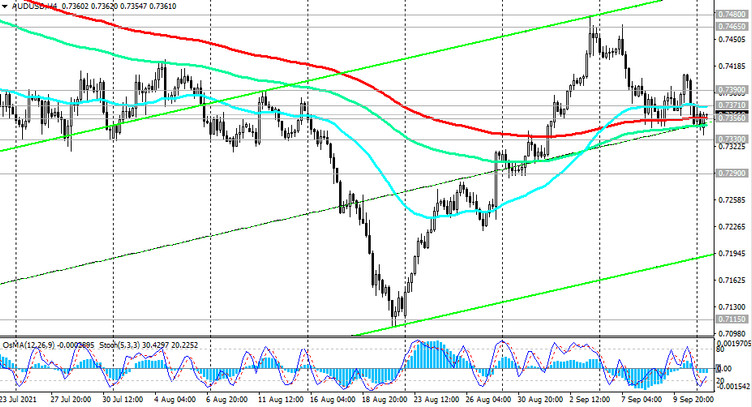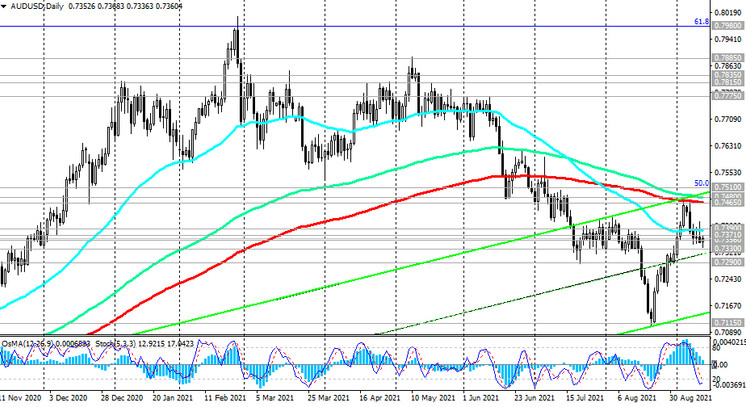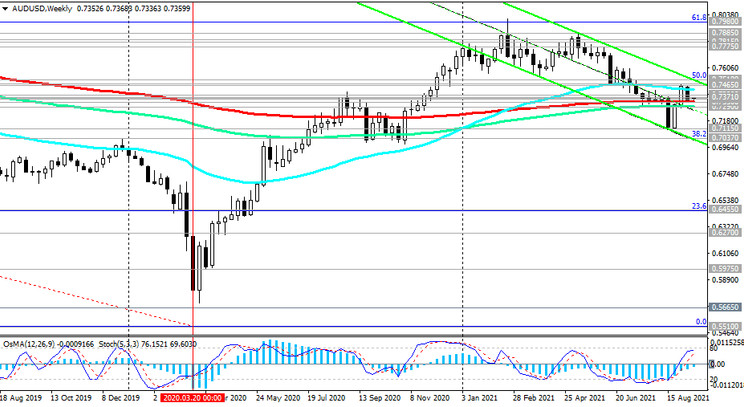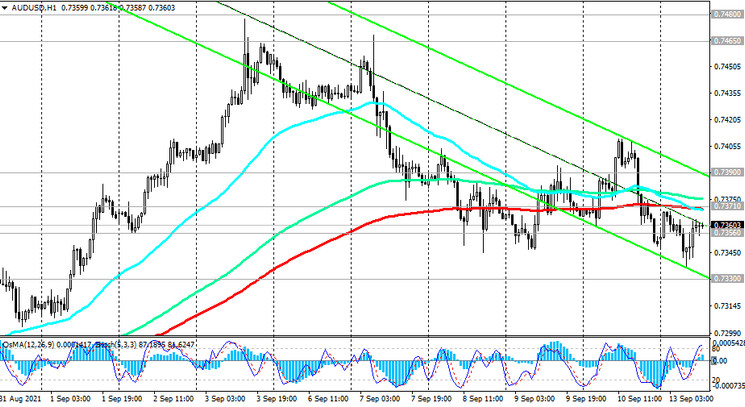
At the time of publication of this article, AUD / USD is traded near the 0.7360 mark, in the zone below the important resistance levels 0.7371 (ЕМА200 on the 1-hour chart), 0.7390 (ЕМА50 on the daily chart) and below the key resistance levels 0.7465 (ЕМА200 on the daily chart), 0.7480 (ЕМА144 on the daily chart), 0.7510 (50% Fibonacci retracement to the wave of the pair's decline from 0.9500 in July 2014 to 2020 lows near 0.5510).

Below the resistance levels 0.7371, 0.7390 - only short positions, and AUD / USD will go deep into the descending channel on the weekly chart, towards its lower border and support level 0.7037 (Fibonacci level 38.2%).

In an alternative scenario, the breakdown of the resistance levels 0.7465, 0.7480, 0.7510 will indicate the resumption of the upward trend in AUD / USD and its return to the bullish long-term market.
The first signal for the alternative scenario will be a breakdown of the short-term resistance level 0.7371.
Support levels: 0.7330, 0.7290, 0.7115, 0.7037
Resistance levels: 0.7356, 0.7371, 0.7390, 0.7465, 0.7480, 0.7510
Trading Recommendations
Sell-Stop 0.7335. Stop-Loss 0.7375. Take-Profit 0.7290, 0.7115, 0.7037
Buy Stop 0.7375. Stop-Loss 0.7335. Take-Profit 0.7390, 0.7465, 0.7480, 0.7510, 0.7775


