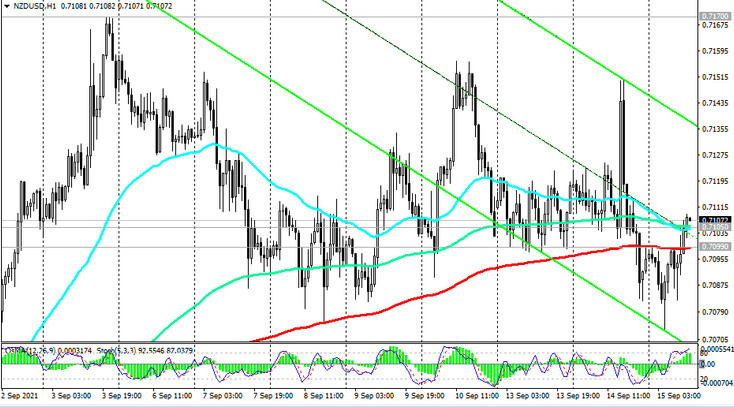
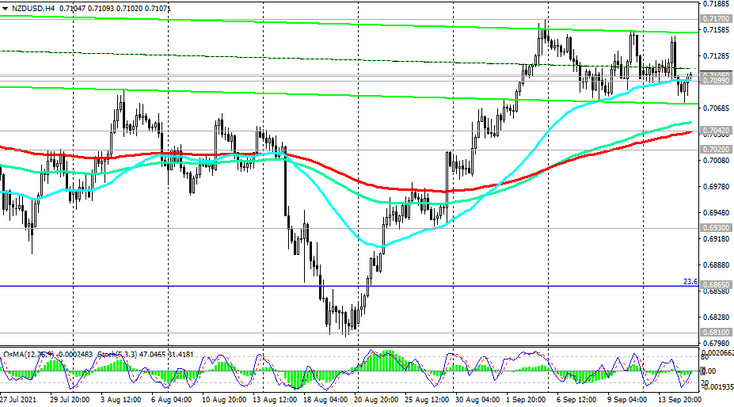
Having broken through the important resistance levels 0.7020 (ЕМА200 on the daily chart) and 0.7042 (ЕМА144 on the daily chart, ЕМА200 on the 4-hour chart) at the end of last month, NZD / USD continues to develop an upward trend, traded in the bull market zone.
Above the important short-term support level 0.7099 (ЕМА200 on 1-hour chart), only long positions should be opened. Targets - at resistance levels 0.7170, 0.7240 (Fibonacci level 38.2% retracement in the global wave of the pair's decline from the mark of 0.8820), 0.7315. More distant growth targets are located at resistance levels 0.7430, 0.7550 (50% Fibonacci level), 0.7600.
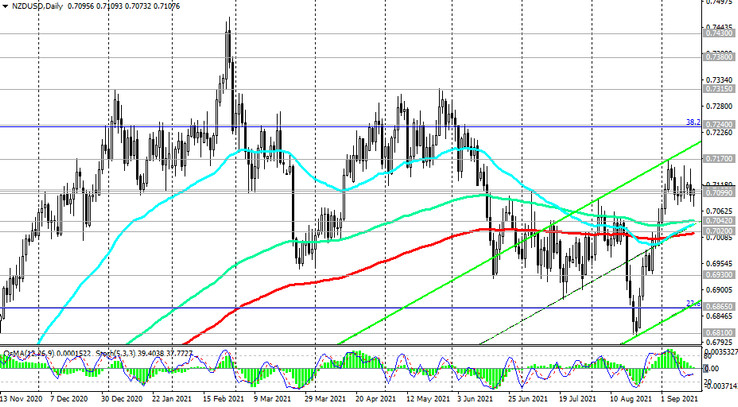
In an alternative scenario and after a confirmed breakdown of the support level 0.7020, NZD / USD will go to the support level 0.6865 (Fibonacci level 23.6% and ЕМА200 on the weekly chart).
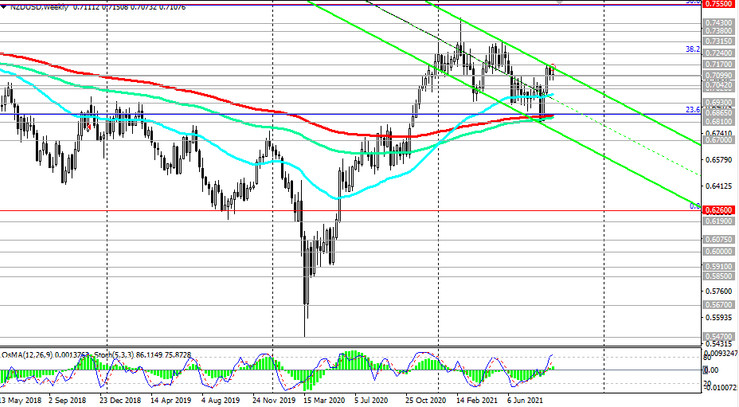
A breakdown of the 0.6700 support level (the lower line of the descending channel on the weekly chart) could finally push the NZD / USD into the bear market zone and return it to the global downtrend that began in July 2014. The first signal for the implementation of this scenario is a breakout of the support levels 0.7099, 0.7075.
Support levels: 0.7099, 0.7075, 0.7042, 0.7020, 0.6930, 0.6865, 0.6810, 0.6750, 0.6700
Resistance levels: 0.7170, 0.7240, 0.7315, 0.7380, 0.7430, 0.7550, 0.7600
Trading recommendations
Sell Stop 0.7070. Stop-Loss 0.7115. Take-Profit 0.7042, 0.7020, 0.6930, 0.6865, 0.6810, 0.6750, 0.6700
Buy Stop 0.7115. Stop-Loss 0.7070. Take-Profit 0.7170, 0.7240, 0.7315, 0.7380, 0.7430, 0.7550, 0.7600