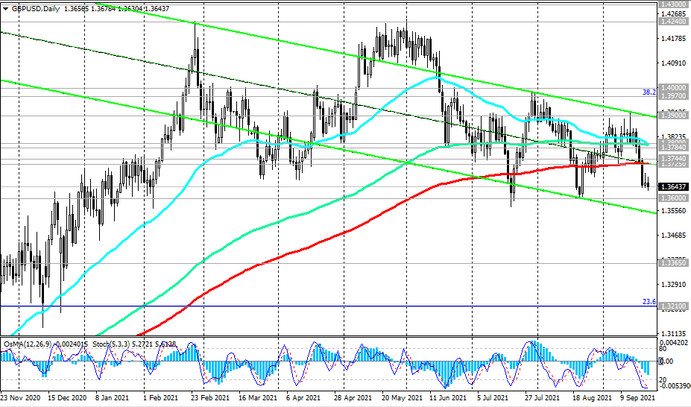
Last Monday, GBP / USD broke through the key long-term support level 1.3725 (ЕМА200 on the daily chart), having thus made a "request" for further decline.
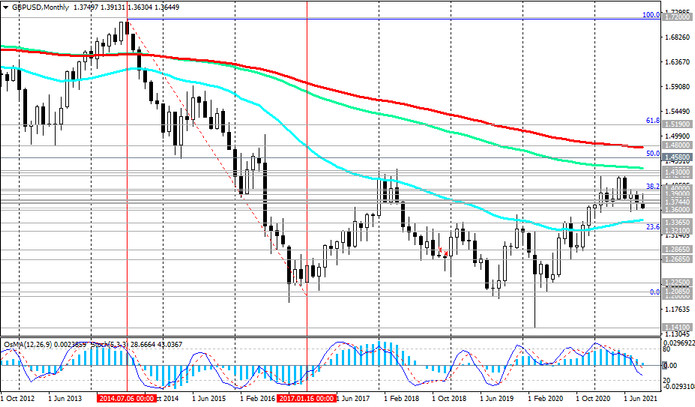
At the time of publication of this article, the GBP / USD pair was traded near another important long-term support level 1.3650 (ЕМА50 on the weekly chart). A breakdown of the local support level 1.3600 will increase the risks of further decline inside the descending channel on the weekly chart with a target at the support level 1.3365 (ЕМА200 on the weekly chart). A breakdown of the support level 1.3210 (Fibonacci level of 23.6% of the correction to the decline of the GBP / USD pair in the wave that began in July 2014 near the mark of 1.7200) will finally return GBP / USD to a long-term bear market.
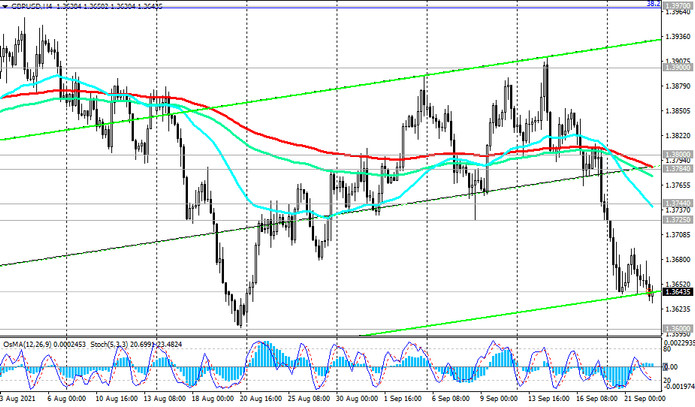
In an alternative scenario, GBP / USD will resume its growth, bouncing off the support level 1.3650. But the signal for the resumption of buying will be the pair's return into the zone above the resistance levels 1.3725, 1.3744 (ЕМА200 on the 1-hour chart).

Support levels: 1.3650, 1.3600, 1.3365, 1.3210
Resistance levels: 1.3725, 1.3744, 1.3784, 1.3800, 1.3900, 1.3970, 1.4000
Trading recommendations
Sell Stop 1.3620. Stop-Loss 1.3710. Take-Profit 1.3600, 1.3365, 1.3210
Buy Stop 1.3710. Stop-Loss 1.3620. Take-Profit 1.3725, 1.3744, 1.3784, 1.3800, 1.3900, 1.3970, 1.4000, 1.4100, 1.4200, 1.4240, 1.4300, 1.4350, 1.4440, 1.4580, 1.4830