During today's Asian trading session, S&P 500 futures were traded higher. However, at the beginning of the European session, the direction of their dynamics changed to a downward one.

As of this writing, S&P 500 futures are near 4455.0, which is the close to Friday's close level.
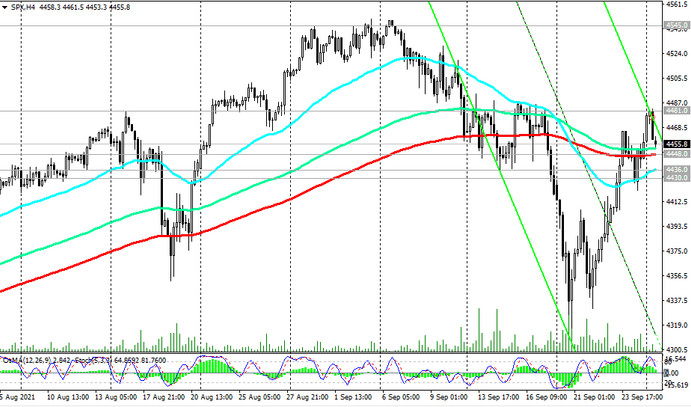
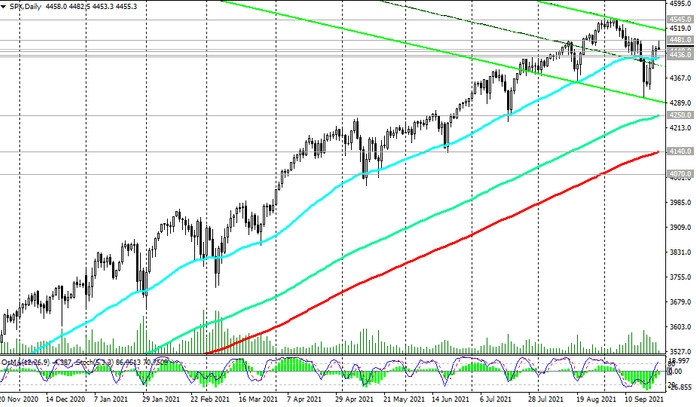
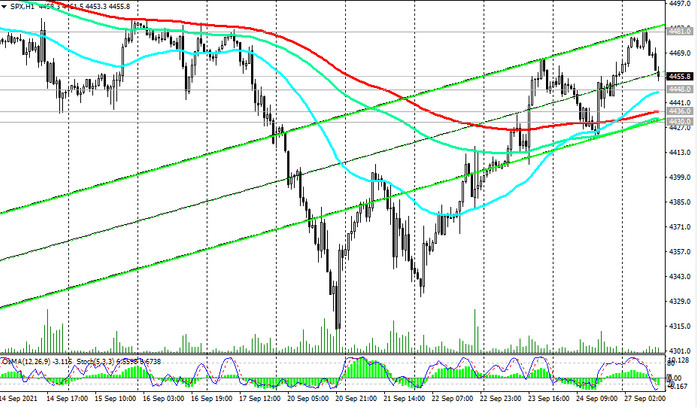
The breakout of the support level 4448.0 (ЕМА200 on the 4-hour chart) will be the first signal to open short positions. A confirmation signal in favor of selling will be a breakdown of the short-term support level 4436.0 (ЕМА200 on the 1-hour chart) and the support level 4430.0 (ЕМА50 on the daily chart).

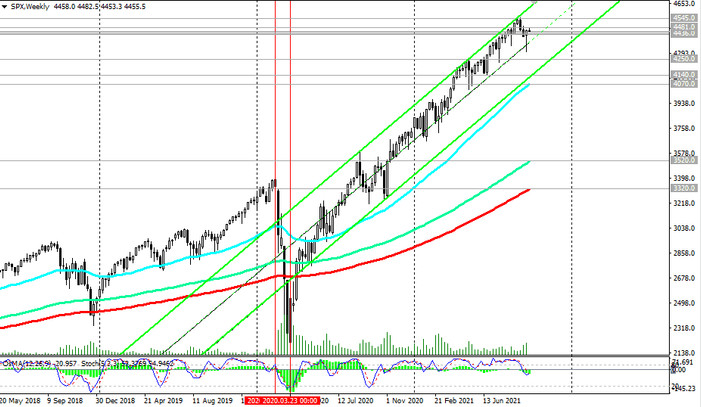
In this case, the targets for the decline will be the support levels 4250.0 (ЕМА144 on the daily chart), 4140.0 (ЕМА200 on the daily chart and the lower border of the ascending channel on the weekly chart).

A breakdown of the long-term support level 4070.0 (ЕМА50 on the weekly chart) will increase the risks of a deeper decline towards the key support levels 3520.0 (ЕМА144 on the weekly chart), 3320.0 (ЕМА200 on the weekly chart). Although, this is still a theoretical view based on technical analysis. In general, the long-term positive dynamics of the S&P 500 prevails, and the breakdown of the local resistance level 4481.0 will signal in favor of long positions with the nearest target at absolute record highs near 4545.0.
In the current situation, above the support level 4430.0, long positions are still preferred.
Support levels: 4448.0, 4436.0, 4430.0, 4300.0, 4250.0, 4140.0, 4070.0
Resistance levels: 4481.0, 4545.0
Trading recommendations
Sell Stop 4441.0. Stop-Loss 4467.0. Targets 4436.0, 4430.0, 4300.0, 4250.0, 4140.0, 4070.0
Buy Stop 4467.0. Stop-Loss 4441.0. Targets 4481.0, 4545.0, 4600.0


