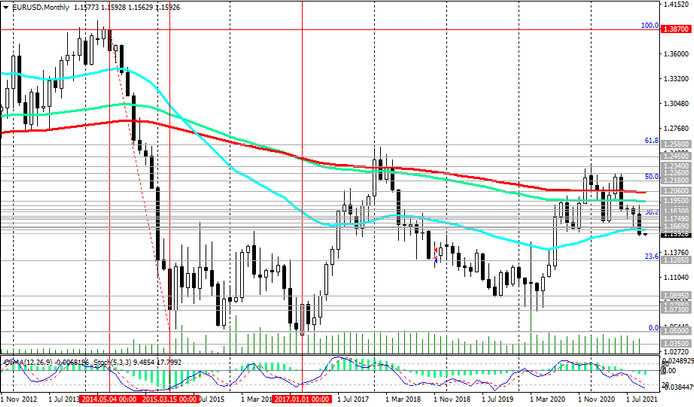
As we noted above, this week the EUR / USD broke through the key support level 1.1630 (ЕМА200 on the weekly chart), which separates the long-term bullish trend from the bearish one.
Given the positive dynamics of the dollar, most likely, the decline in EUR / USD will resume. In this case, the pair will head towards the lower border of the descending channel on the weekly chart, which is currently passing through the 1.1450 level, and then towards the support level 1.1285 (23.6% Fibonacci level of the upward correction in the wave of the pair's decline from the level 1.3870, which began at May 2014, to the level of 1.0500).
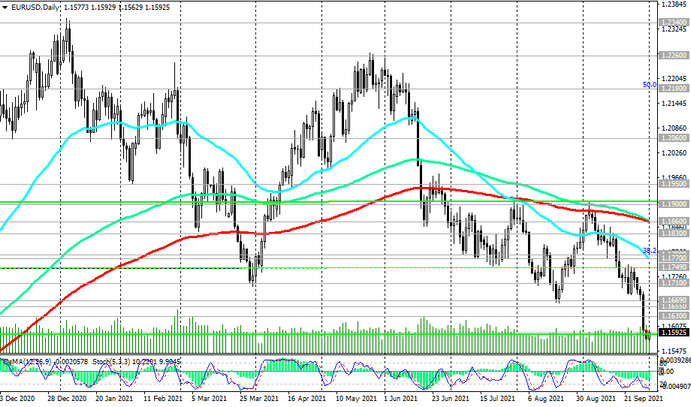
A breakdown of the local support level 1.1565 (local minimums) will be a signal for the development of the scenario of a decline in EUR / USD.
In an alternative scenario and after the breakdown of the resistance levels 1.1630, 1.1655 (ЕМА144 on the weekly chart), 1.1669 (ЕМА200 on the 1-hour chart), EUR / USD may regain its upward trend. However, only a breakdown of the key resistance level 1.1860 (ЕМА200 on the daily chart) will indicate a return of EUR / USD to the bull market.

So far, preference should be given to short positions.
Support levels: 1.1565, 1.1500, 1.1450, 1.1285
Resistance levels: 1.1630, 1.1655, 1.1669, 1.1710, 1.1749, 1.1770, 1.1780, 1.1830, 1.1860, 1.1900, 1.1950, 1.2065, 1.2180, 1.2260, 1.2340, 1.2450, 1.2580, 1.2600
Trading Recommendations
Sell Stop 1.1560. Stop-Loss 1.1640. Take-Profit 1.1500, 1.1450, 1.1285
Buy Stop 1.1640. Stop-Loss 1.1560. Take-Profit 1.1655, 1.1669, 1.1710, 1.1749, 1.1770, 1.1780, 1.1830, 1.1860, 1.1900, 1.1950, 1.2065, 1.2180, 1.2260, 1.2340, 1.2450, 1.2580, 1.2600