
Since the beginning of this month, USD / CAD has gained more than half of the previous month's losses. At the time of publication of this article, the USD / CAD pair is traded near the key long-term resistance level 1.2570 (ЕМА200 and the upper border of the descending channel on the daily chart). Below this level, USD / CAD remains in the bear market zone.
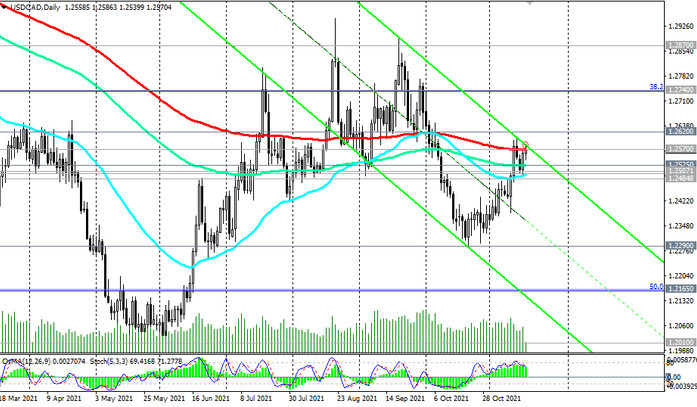
Therefore, the breakdown of the support levels 1.2575 (EMA144 on the daily chart), 1.2500 (EMA50 on the daily chart), 1.2484 (EMA200 on the 4-hour chart) will be a signal for the resumption of short positions.
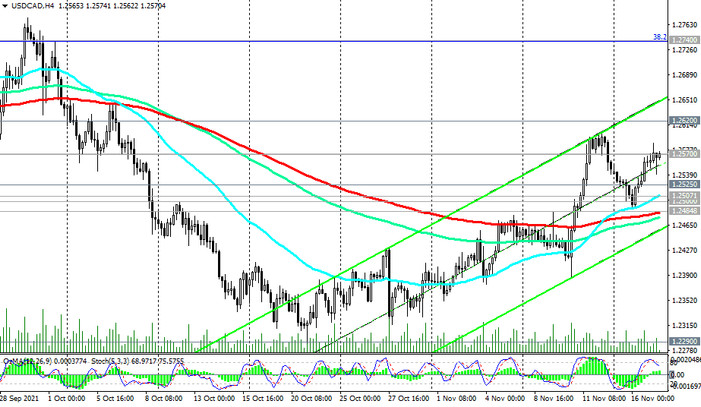
Nevertheless, our main scenario assumes a breakdown of the resistance level 1.2570, and a rise into the zone above the resistance level 1.2620 (ЕМА50 on the weekly chart) will indicate the resumption of the medium-term bullish trend in USD / CAD. In this case, the nearest growth target will be located near the resistance level 1.2740 (Fibonacci level 38.2% of the downward correction in the wave of USD / CAD growth from 0.9700 to 1.4600). A breakdown of the resistance level 1.2870 (ЕМА200 on the weekly chart) will indicate the resumption of the long-term bullish trend in USD / CAD.
Support levels: 1.2525, 1.2507, 1.2500, 1.2484, 1.2290, 1.2165, 1.2010, 1.1580
Resistance levels: 1.2570, 1.2620, 1.2740, 1.2870
Trading scenarios
Sell Stop 1.2530. Stop-Loss 1.2610. Take-Profit 1.2507, 1.2500, 1.2484, 1.2290, 1.2165, 1.2010, 1.1580
Buy Stop 1.2610. Stop-Loss 1.2530. Take-Profit 1.2700, 1.2740, 1.2870, 1.3200