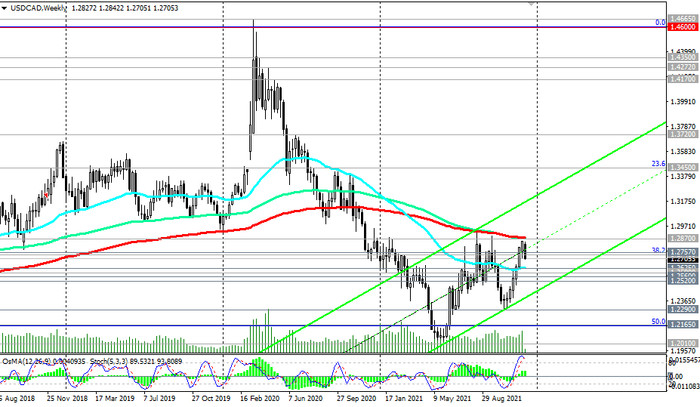
Having come close to the key resistance level 1.2870 (EMA200 on the weekly chart) last Friday, USD / CAD still could not overcome it and resumed its decline earlier this week.

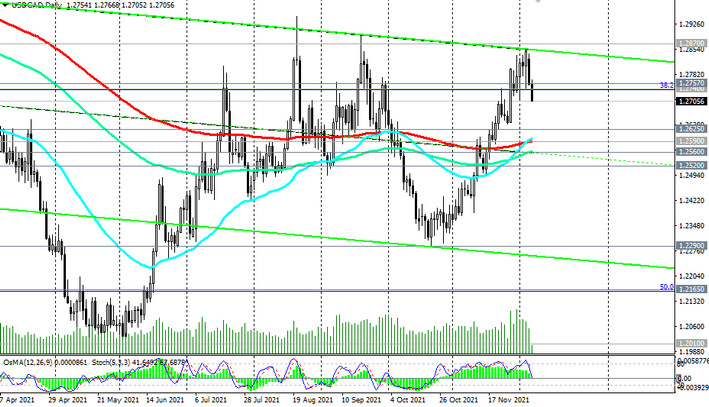
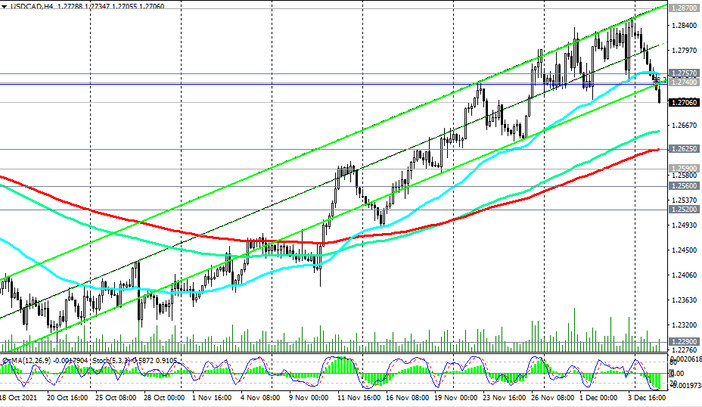
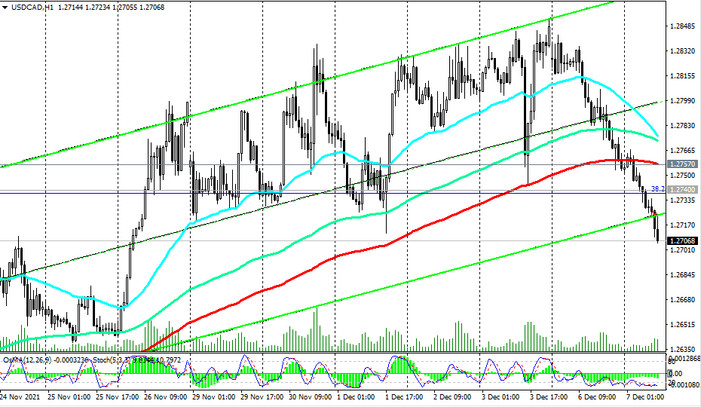
Yesterday USD / CAD broke through the important short-term support level 1.2757 (ЕМА200 on the 1-hour chart) and continues to decline today, moving towards the support levels 1.2660 (ЕМА144 on the 4-hour chart), 1.2625 (ЕМА200 on the 4-hour chart and ЕМА50 on the weekly chart).

However, only after the breakdown of the key support level 1.2520 (ЕМА200 on the monthly chart), a more stable decline and transition into the bearish market should be expected.

In an alternative scenario, USD / CAD will resume its growth. A breakdown of the 1.2870 resistance level will mark the end of the downward correction and a return into the bull market.
The first signal to resume long positions will be a breakdown of the important short-term resistance level 1.2757.

Support levels: 1.2660, 1.2625, 1.2590, 1.2560, 1.2520, 1.2290, 1.2165, 1.2010
Resistance levels: 1.2740, 1.2757, 1.2870, 1.2900
Trading scenarios
Sell Stop 1.2670. Stop-Loss 1.2770. Take-Profit 1.2625, 1.2590, 1.2560, 1.2520, 1.2290, 1.2165, 1.2010
Buy Stop 1.2770. Stop-Loss 1.2670. Take-Profit 1.2800, 1.2840, 1.2870, 1.2900, 1.3000, 1.3200


