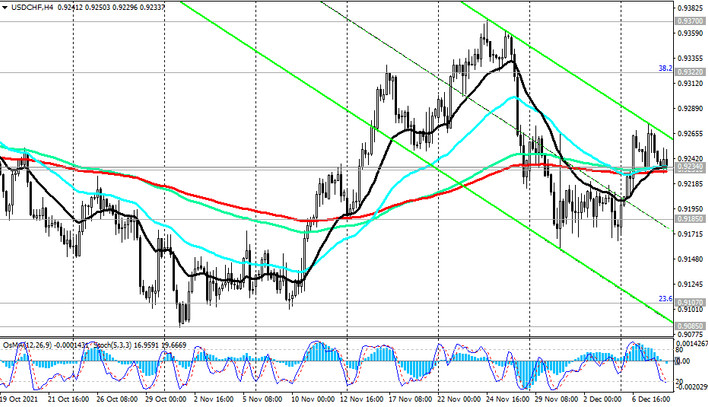
Since the beginning of this month, USD / CHF has been growing, bouncing at the beginning of this week from the key support level 0.9185 (ЕМА200 on the daily chart) and developing the upward trend that emerged at the beginning of the year. At the time of publication of this article, USD / CHF is traded near 0.9234, 0.9231 marks, through which important short-term support levels (ЕМА200 on 1-hour and 4-hour charts) pass.
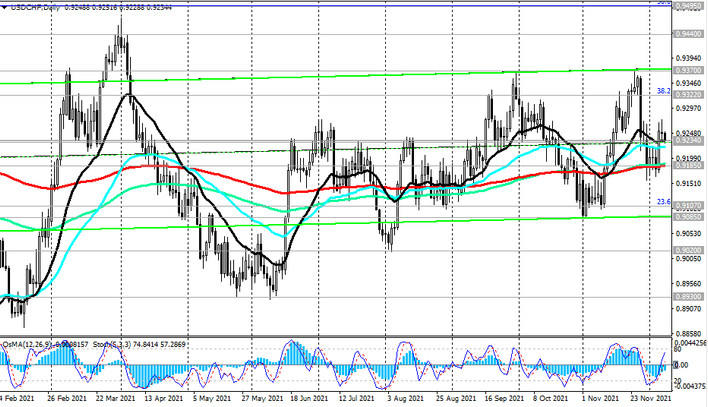
Above these levels and the key support level 0.9185, long positions remain preferred. Therefore, the breakdown of today's intraday high of 0.9251 will be a signal to build up long positions with targets at resistance levels 0.9370 (ЕМА144 on the weekly chart), 0.9440 (ЕМА200 on the weekly chart), 0.9495 (Fibonacci level 50% of the correction to the decline wave that began in April 2019 near marks 1.0235).
The breakdown of the resistance levels 0.9440, 0.9495 will indicate the return of USD / CHF into the zone of the long-term bull market.
In an alternative scenario, a sell signal will be a breakout of today's intraday low 0.9226. Break of the support level 0.9185 (ЕМА200, ЕМА144 on the daily chart) will return USD / CHF into the long-term bear market zone.
In the current situation, the main scenario of further USD / CHF growth is preferable.
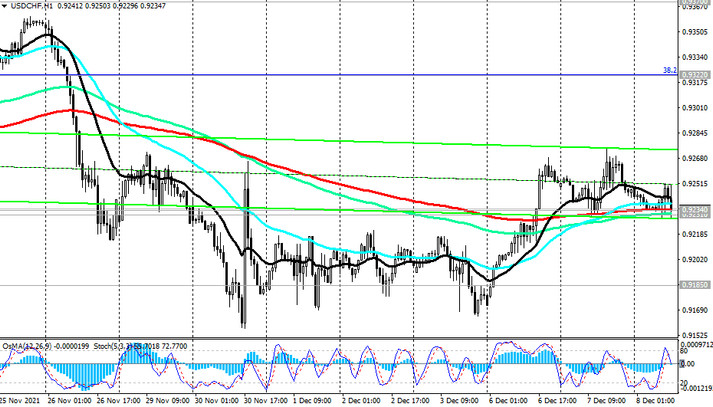
Support levels: 0.9234, 0.9231, 0.9225, 0.9200, 0.9185, 0.9107, 0.9085
Resistance levels: 0.9250, 0.9322, 0.9370, 0.9440, 0.9495, 0.9670
Trading scenarios
Sell Stop 0.9220. Stop-Loss 0.9255. Take-Profit 0.9200, 0.9185, 0.9107, 0.9085
Buy Stop 0.9255. Stop-Loss 0.9220. Take-Profit 0.9300, 0.9322, 0.9370, 0.9440, 0.9495, 0.9670


