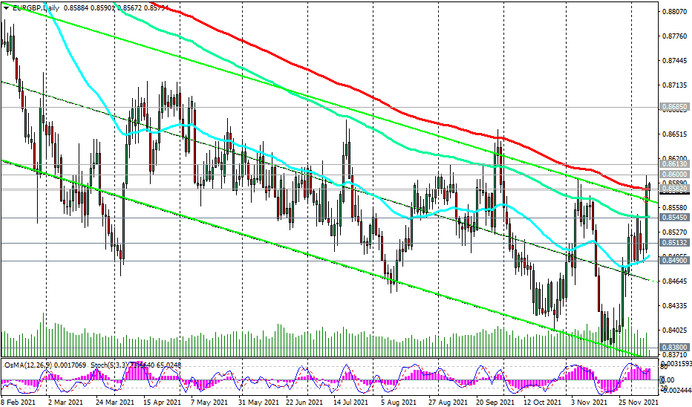
As we noted above, the EUR / GBP has been growing since the middle of last month. Yesterday the pair attempted to break through the key long-term resistance level 0.8582 (ЕМА200 on the daily chart). The price briefly climbed to the 0.8600 mark, but then declined, returning to the 0.8582 level. At the beginning of today's European session, EUR / GBP again tries to break into the zone above this resistance level, and in case of breakdown of the resistance level 0.8613 (ЕМА50 and the upper line of the descending channel on the weekly chart), it may rise to the long-term resistance level 0.8685 (ЕМА200 on the weekly chart). Further growth above this level is unlikely. One way or another, EUR / GBP remains in a global downtrend.
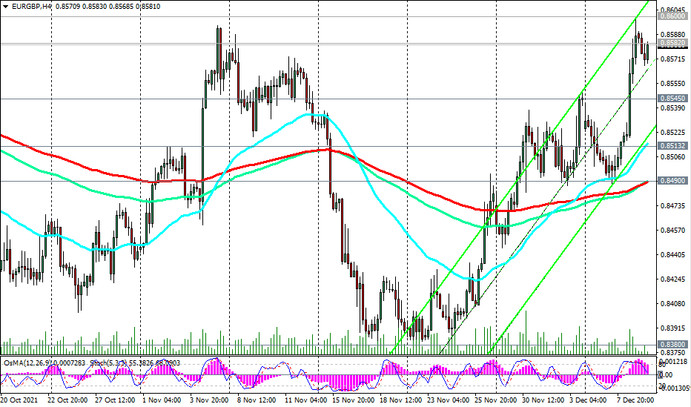
Therefore, at the first signs of a resumption of decline, one should look for an opportunity to enter short positions.
The first signal in this case may be a breakdown of the support levels 0.8552 (ЕМА200 on the 15-minute chart), 0.8545 (ЕМА144 on the daily chart).
A breakdown of the support level 0.8490 (ЕМА200 on the 4-hour chart) in this case will become a confirmation signal for selling EUR / GBP.
The downtrend prevails, clearly expressed by the descending channel on the weekly chart. Its lower border lies between the support levels of 0.8380 (local minimum) and 0.8330 (ЕМА144 on the monthly chart).
In case of further decline, these support levels will be the nearest targets. A break of the key long-term support level 0.8120 (ЕМА200 on the monthly chart) will finally move EUR / GBP into the long-term bear market zone.
Support levels: 0.8545, 0.8513, 0.8490, 0.8380, 0.8330, 0.8120
Resistance levels: 0.8582, 0.8600, 0.8613, 0.8685
Trading Recommendations
Sell Stop 0.8560. Stop-Loss 0.8605. Take-Profit 0.8545, 0.8513, 0.8490, 0.8380, 0.8330, 0.8120
Buy Stop 0.8605. Stop-Loss 0.8560. Take-Profit 0.8613, 0.8685

