As we noted above, NZD / USD is in the bear market zone, trading below the key resistance levels 0.6865 (ЕМА200 on the weekly chart and Fibonacci level 23.6% retracement in the global wave of the pair's decline from the level of 0.8820), 0.6995 (ЕМА200 on the daily chart).
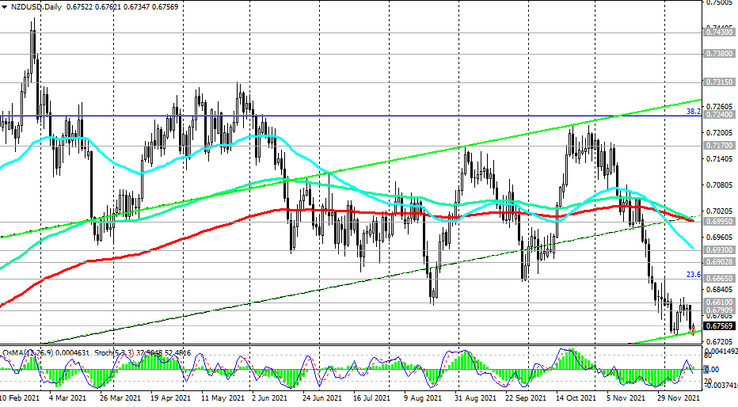
During today's Asian trading session, the price renewed its 13-month low at 0.6735. A breakdown of this local support level will be a signal to build up short positions.
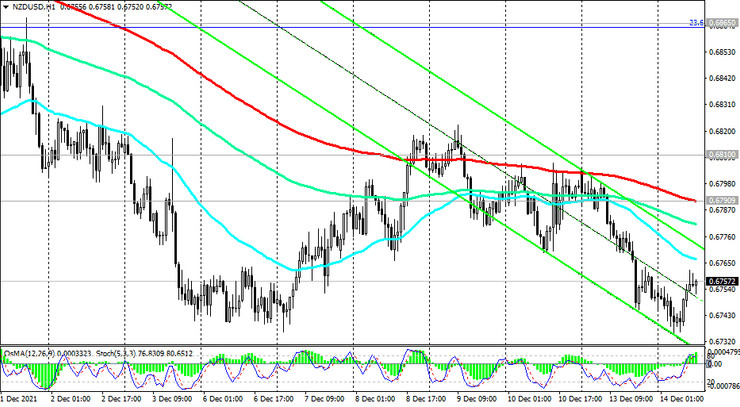
In an alternative scenario, and after the breakdown of the resistance level 0.6865, NZD / USD will go towards the resistance levels 0.6995, 0.7100, 0.7170. More distant growth targets are located at resistance levels 0.7240 (Fibonacci level 38.2%), 0.7430, 0.7550 (Fibonacci level 50%), 0.7600, and the first signal for the implementation of this scenario may be the breakdown of an important short-term resistance level 0.6790 (EMA200 on the 1-hour chart).
In the current situation, the determining factor in the dynamics of NZD / USD is likely to be the monetary policy of the central banks of the United States and New Zealand. And, most likely, the conventional "scale" will tilt towards the currency of the country, whose central bank will take a tougher position. In general, the downward dynamics of NZD/USD prevails.
Support levels: 0.6735, 0.6700
Resistance levels: 0.6790, 0.6810, 0.6865, 0.6900, 0.6930, 0.6995, 0.7100, 0.7170, 0.7240, 0.7315, 0.7380, 0.7430, 0.7550, 0.7600
Trading recommendations
Sell Stop 0.6730. Stop-Loss 0.6775. Take-Profit 0.6700, 0.6600, 0.6500, 0.6260
Buy Stop 0.6775. Stop-Loss 0.6730. Take-Profit 0.6790, 0.6810, 0.6865, 0.6900, 0.6930, 0.6995, 0.7100, 0.7170, 0.7240, 0.7315, 0.7380, 0.7430, 0.7550, 0.7600