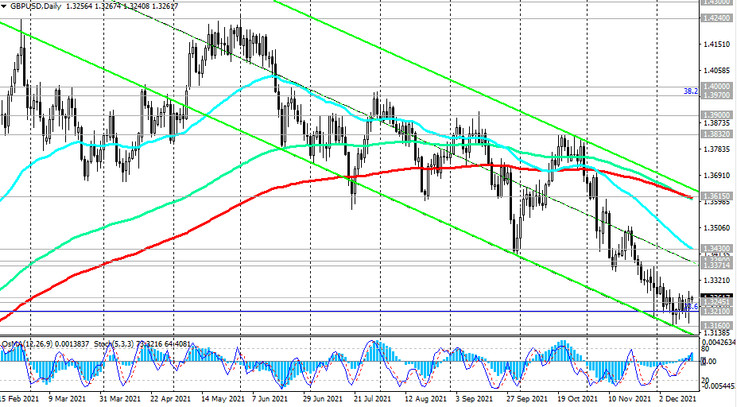
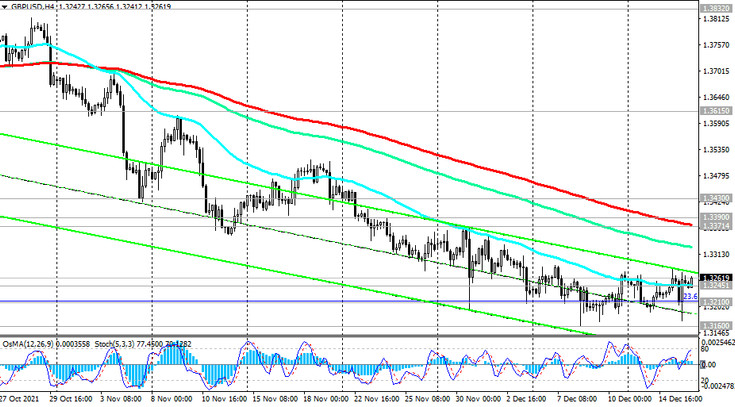
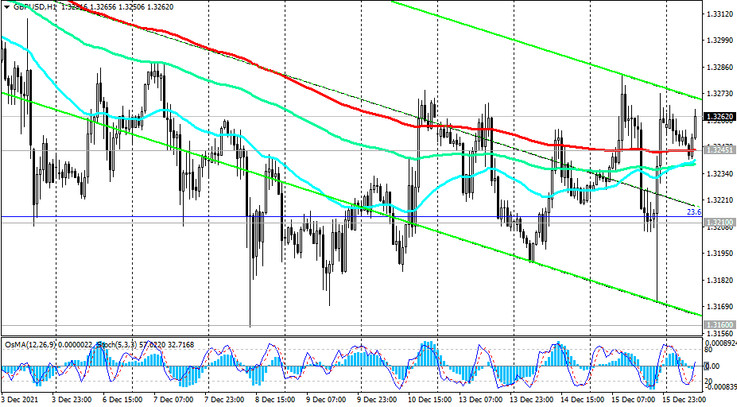
Despite the downtrend, GBP / USD is trying to develop upward dynamics in the short term. The price has broken through the important short-term resistance level 1.3245 (ЕМА200 on the 1-hour GBP / USD chart) and is trying to accelerate corrective gains at the beginning of today's European session. If this growth continues, its target may be resistance levels 1.3371 (ЕМА200 on the 4-hour chart), 1.3390 (ЕМА200 on the weekly chart).

But a breakout into the zone above the resistance level 1.3430 (ЕМА50 on the daily chart) creates a threat of further growth towards the key resistance level 1.3615 (ЕМА200, ЕМА144 and the upper border of the descending channel on the daily chart). Its breakdown may signal the end of the GBP / USD downtrend.

Still, the main scenario for now is the bearish GBP / USD trend, and the preferred positions are short ones. However, in order to resume them, you should still wait for the price to return into the zone below the level 1.3245. Its breakdown will be a signal to open new short positions in GBP / USD. A breakdown of the local support level 1.3160 will open the way for a decline towards 1.3000, 1.2700 marks.

Support levels: 1.3245, 1.3210, 1.3160, 1.3000, 1.2865, 1.2685
Resistance levels: 1.3371, 1.3390, 1.3430, 1.3615, 1.3700, 1.3832, 1.3900, 1.3970, 1.4000
Trading recommendations
Sell Stop 1.3235. Stop-Loss 1.3320. Take-Profit 1.3210, 1.3160, 1.3000, 1.2865, 1.2685
Buy Stop 1.3320. Stop-Loss 1.3235. Take-Profit 1.3390, 1.3430, 1.3615, 1.3700, 1.3832, 1.3900, 1.3970, 1.4000


