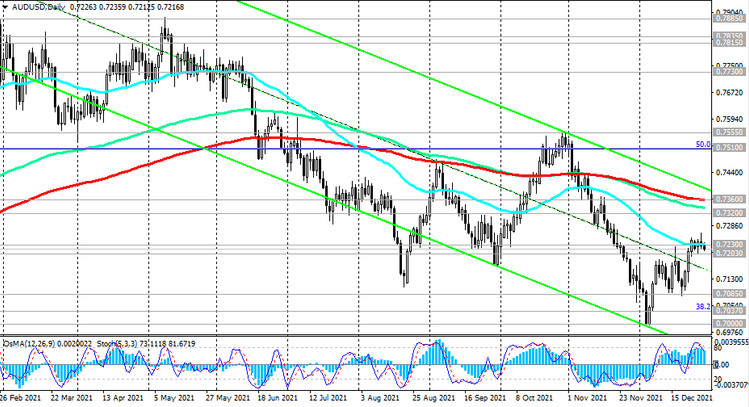
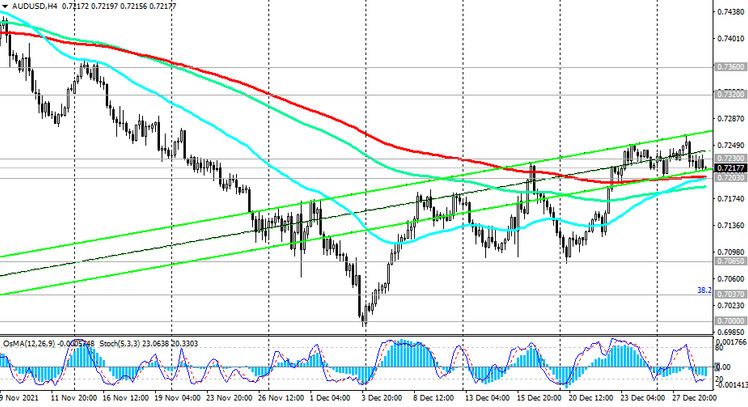
During the correction since the beginning of this month, AUD / USD has grown, having received support from the results of the RBA meeting on December 7, and reaching the important resistance level 0.7230 (ЕМА50 on the daily chart). Meanwhile, the pair remains in the long-term bear market zone below the key resistance levels 0.7730 (ЕМА200 on the monthly chart), 0.7360 (ЕМА200 on the daily chart), 0.7320 (ЕМА200 on the weekly chart).

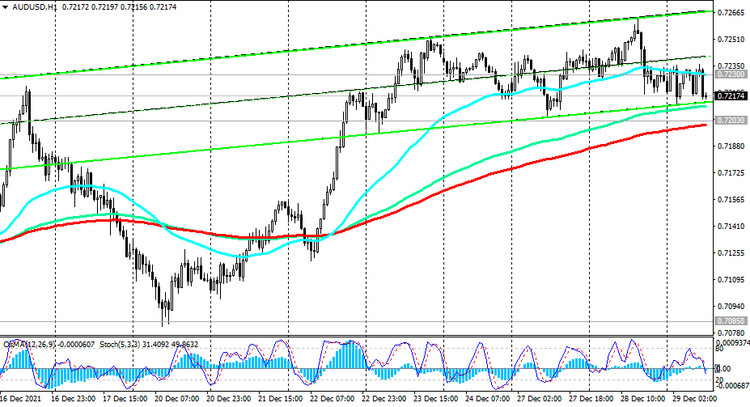
A further decline in AUD / USD is most likely from both a technical and a fundamental point of view. A signal for new sales will be a breakdown of the short-term support level 0.7203 (ЕМА200 on the 1-hour and 4-hour charts). The intermediate target of the decline is local minimums near the 0.7000 mark, and the minimums of the recent next wave of decline are near the 0.5510 mark.

In an alternative scenario, corrective growth may continue towards the resistance levels 0.7300, 0.7320.

However, only a rise into the zone above the key long-term resistance level 0.7360 (ЕМА200 on the daily chart) will indicate the resumption of the long-term bullish trend in AUD / USD. Immediate growth targets after that will be located at resistance levels 0.7510 (Fibonacci level 50% retracement to the wave of the pair's decline from 0.9500 in July 2014 to 2020 lows near 0.5510) and near the local 3-month high of 0.7555, reached at the end of October.
Support levels: 0.7203, 0.7135, 0.7085, 0.7037, 0.7000
Resistance levels: 0.7230, 0.7300, 0.7320, 0.7360
Trading Recommendations
Sell Stop 0.7190. Stop-Loss 0.7265. Take-Profit 0.7135, 0.7085, 0.7037, 0.7000, 0.6900, 0.6800, 0.6455, 0.6270, 0.5975, 0.5665, 0.5510
Buy Stop 0.7265. Stop-Loss 0.7190. Take-Profit 0.7300, 0.7320, 0.7360, 0.7510, 0.7555


