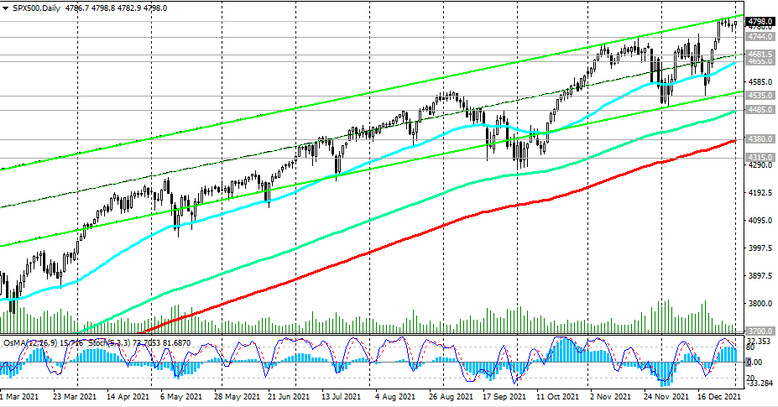
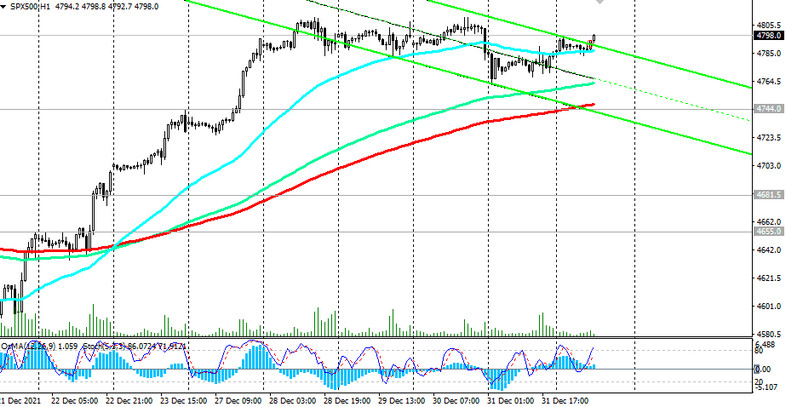
As we noted above, the American broad market S&P 500 index, in the wake of the pre-New Year rally, reached a new all-time high near 4811.0 at the end of the year.
Its and the entire American market as whole positive dynamics remain. A breakdown of the local resistance level 4811.0, obviously, will be a signal for the resumption of long positions.

In an alternative scenario, the breakdown of the support level 4666.0 (ЕМА200 on the 1-hour chart and the local high) will be the first signal for selling and may trigger a further decline in the S&P 500 with targets at support levels 4655.0 (ЕМА50 on the daily chart), 4485.0 (ЕМА144 on the daily chart), 4380.0 (ЕМА200 on the daily chart), 4315.0 (ЕМА50 on the weekly chart).

But, above support level 4744.0 long positions are preferable.
Support levels: 4744.0, 4681.0, 4655.0, 4535.0, 4485.0, 4380.0, 4315.0
Resistance levels: 4811.0, 4900.0
Trading recommendations
Sell Stop 4740.0. Stop-Loss 4815.0. Targets 4700.0, 4681.0, 4655.0, 4535.0, 4485.0, 4380.0, 4315.0
Buy Stop 4815.0. Stop-Loss 4740.0. Targets 4900.0, 5000.0


